The main question when using remote sensed raster data, as we do, is the question of NaN-treatment. Many R functions are able to use an option like rm.NaN=TRUE to treat these missing values. In our case the kmeans function in R is not capable to use such a parameter. After reading the tif-files and creating of a layer stack we will go on with a work-around to solve the missing values problem of the non-covered areas of a Landsat picture.
First: get the data
In the part one we have already described where to get the data. As the used dataset contains surface reflectance values and the calculation of these values results in additional missing values inside the taken Landsat picture we will go with the original digital numbers by Landsat: Download and unzip the bands one to five and seven from this location.
Second: prepare the data
Now stick with the mentioned tutorial:
setwd(“~/wd_r/ETM”)
library(“raster”)
A <- stack(c("p134r027_7t20010820_z48_nn10.tif","p134r027_7t20010820_z48_nn20.tif","p134r027_7t20010820_z48_nn30.tif","p134r027_7t20010820_z48_nn40.tif","p134r027_7t20010820_z48_nn50.tif", "p134r027_7t20010820_z48_nn70.tif"))
[/sourcecode]
Now we will create a rectangular subset of our desired region using a plot of the Landsat image and an interactive method to obtain the extent. Please be aware to take only the covered region!!!:
[sourcecode language="R"]
plotRGB(A, 3,2,1)
ext <- drawExtent() #draw a box by clicking upper left and lower right corner in the plot
C <- crop(A, ext)
[/sourcecode]
Third: classify the data
The classification itself will be done on a corresponding dataframe:
DF <- as.data.frame(C)
summary(C) # to make sure you don't have any NA's
E <- kmeans(DF, 12, iter.max = 100, nstart = 10)
[/sourcecode]
We have chosen 12 classes because it is much easier to merge classes after classification than to split classes. 12 classes will be detailed enough but still fast to get a result for the given area in Mongolia. It could be possible to start with another number for your desired area. If you have a lot of different possible land covers you should increase this number. We will set the number of maximal iterations to 100 to make sure that less then 5% of the pixels are changing their class after one step.
The main problem in R seems to be the availability of R. My system is build up by Intel Centrino 2 Dual Core 2.53Ghz with 8GB of RAM and a SSD. But the classification of 14 million objects of a dataframe had taken much longer than I was used from ArcGIS or Erdas Imagine. (If you see improvement mail me please!!!)
Here’s how to create a raster from the resulting kmeans object:
DF[,7] <- E$cluster
EM <- matrix(DF[,7], nrow=DF@nrows,ncol=DF@ncols, byrow=TRUE)
E.raster <- raster(EM,crs=C@crs, xmn=C@extent@xmin, ymn=C@extent@ymin, xmx=C@extent@xmax, ymx=C@extent@ymax)
writeRaster(E.raster,"12_classes.tif", overwrite=TRUE)
[/sourcecode]
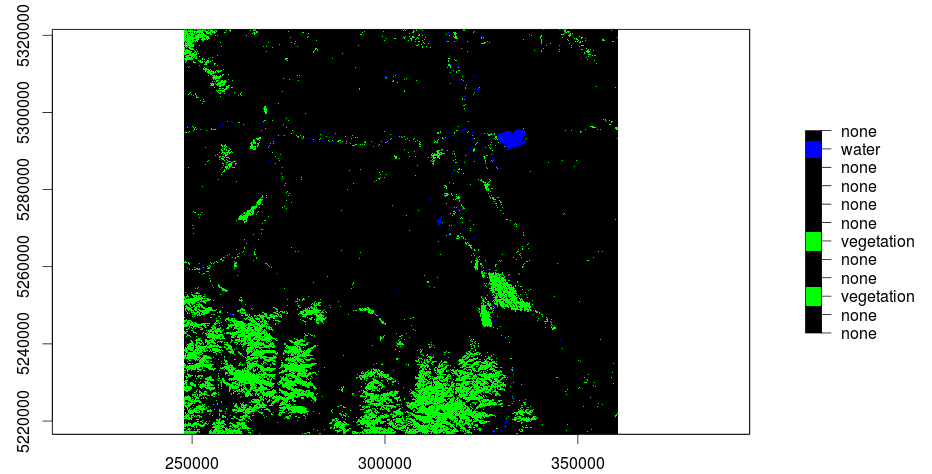
And here is the result in QGIS:
[caption id="attachment_503" align="aligncenter" width="300" caption="kmeans with 12 classes: green-vegetation, blue-water (click to enlarge)"]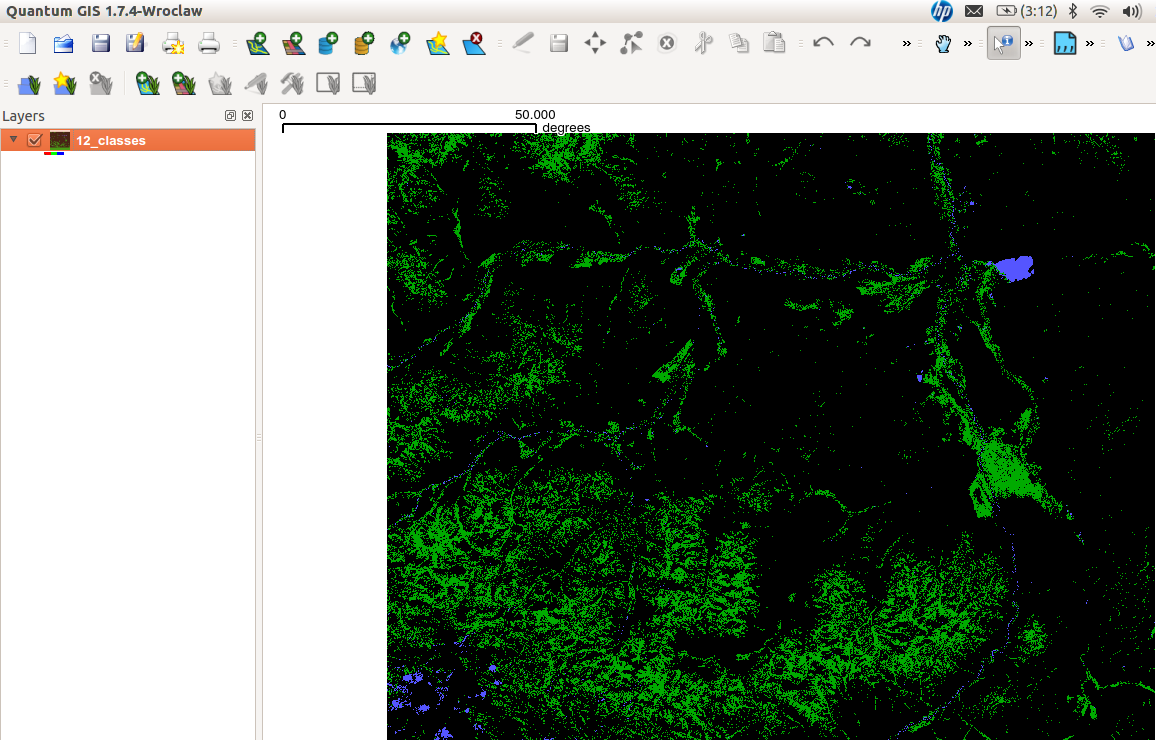 [/caption]

Is it possible to to color the resulting 12 clusters within your original image to get a feel for visual separation?
Greets,
Andrej
thanks for your comment. I’ll check with plot arguments and present a little article to that in a few days. best, riccardo
I was trying to repeat your example, but when I need that Kmeans meake the unsupervised classification give me this error:
“Error: empty cluster: try a better set of initial centers”
Coul you please explain me why i get this error?
this could be due to several failures. first make sure that you have multiple layers. than: how many cluster centers have you tried to get? how many objects/pixels do you want to classify. there should be a good balance on nr. of objects, their variance (no variance means no need of many clusters) and the number of clusters you would like to get. maybe set the number of clusters to a lower value ?
Ricckli actually I was trying to replicate the example, but I get those errors. I was hoping you gimme a hand, because this could be a great solution that I have to classify some images
Regards
thanks for your comment. describe your errors in an E-Mail to blog@statgis.com. I will try to help…