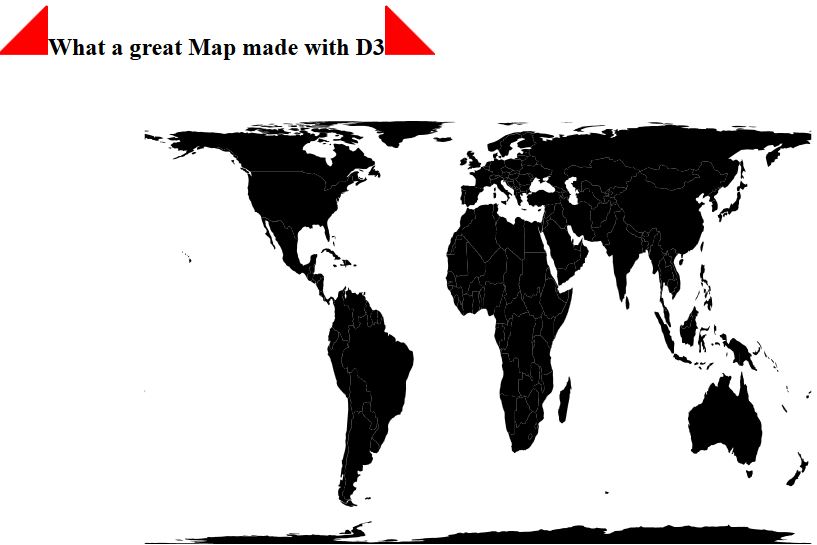
D3: My First Webmap
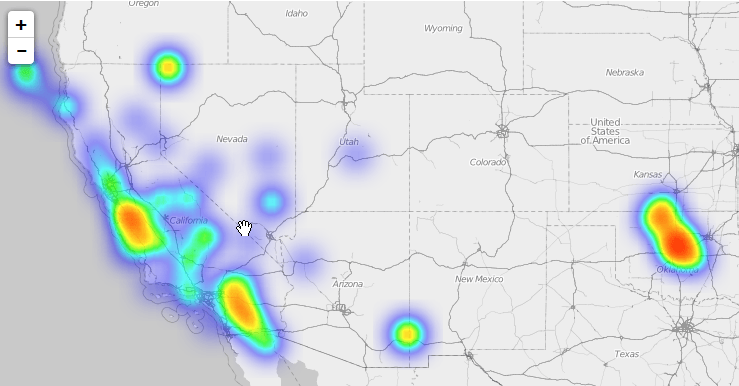
I always watched those stunning examples created with D3 by Mike Bostock, I liked Ralf’s blog posts here and I always thought to myself: get yourself together and…

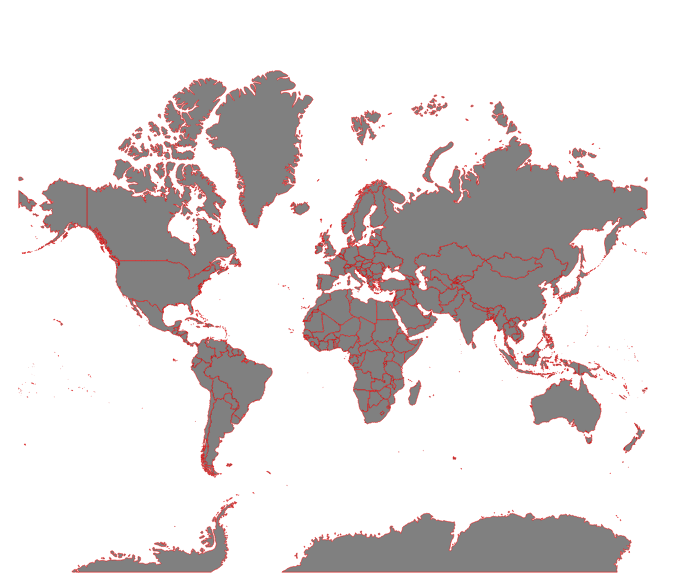
When working with raster datasets, it is hard to keep an overview of the raster files in use and their coverage. Most raster data providers may keep metadata…
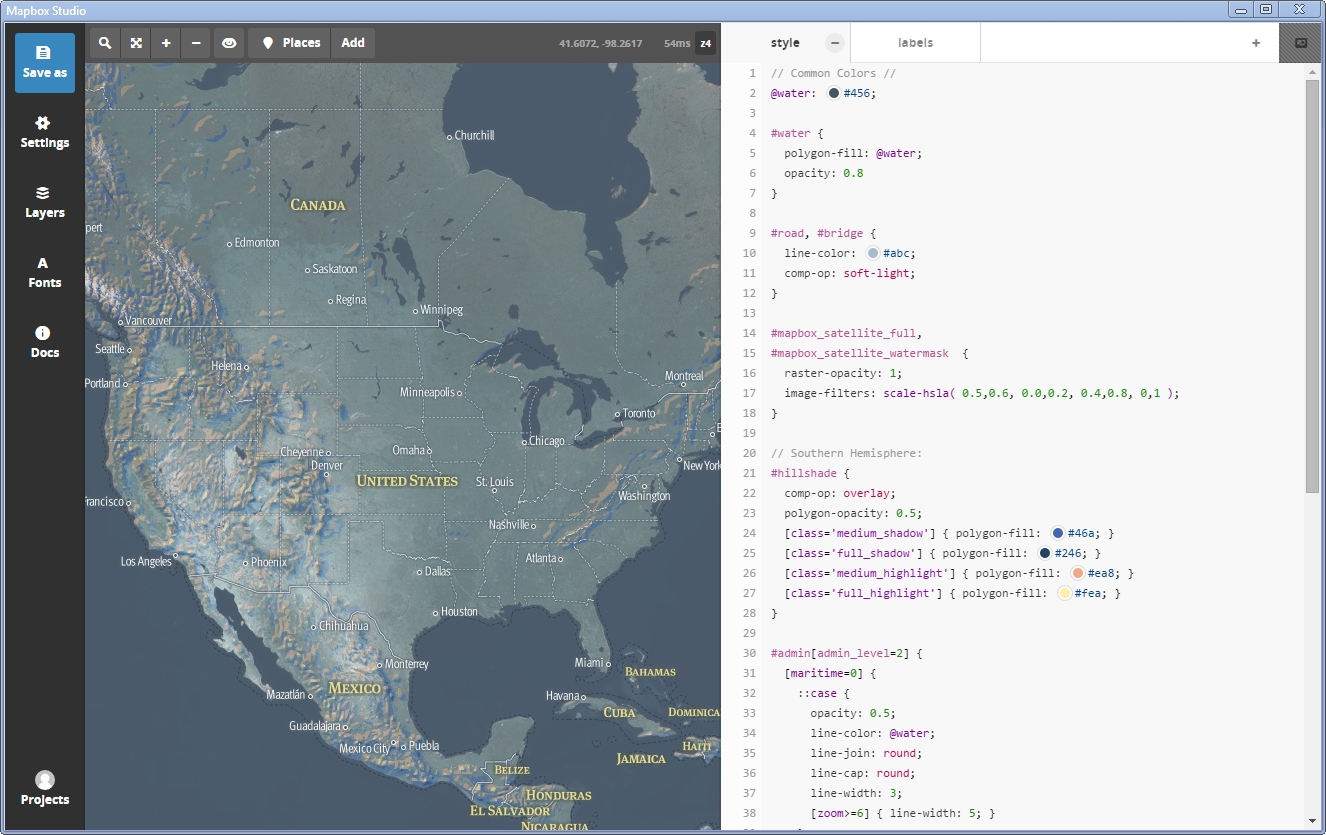
The new Mapbox Studio was unveiled and we want to give you a first tutorial to master the installation, understand the GUI and create your first map.
This is the first digital-geography.com tutorial for setting up an initial webmap with D3.js-JavaScript library by Mike Bostock.

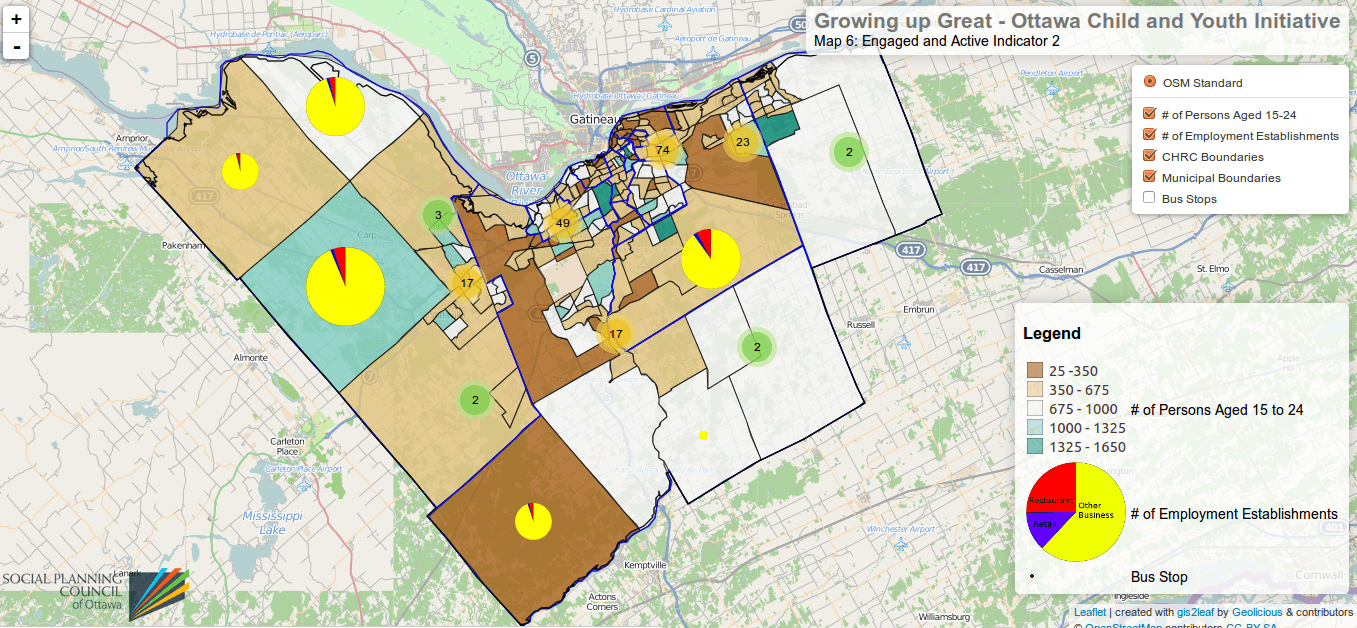
This tutorial will explain you how to create your own, interactive webmap in a fast and easy way! Such webmaps are used zo visualize e.g. adresses on digital maps. I’m using QGis 2.4 + Qgis Plugin Qgis2Leaf, google spreadsheet and a macro, wich I’ll tell you later about.
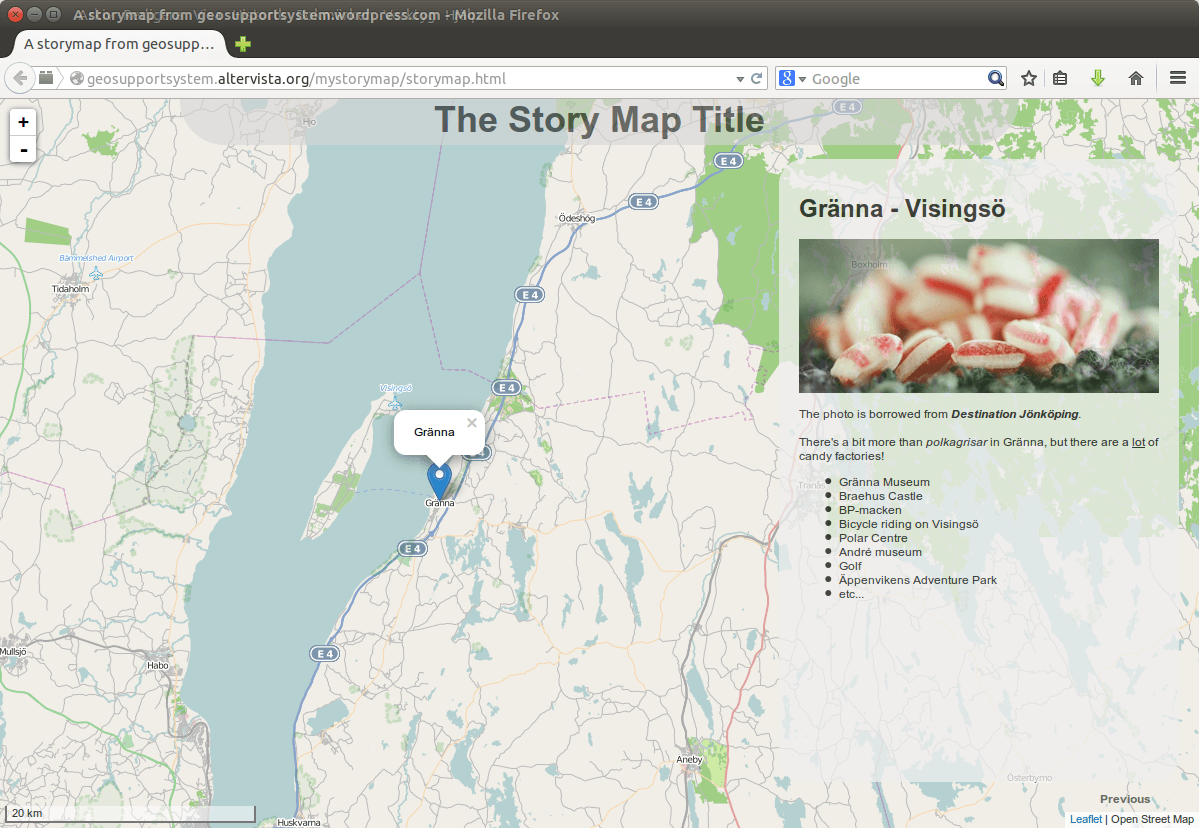
Have you seen “the story maps” created on the ESRI website (http://storymaps.arcgis.com) or for that matter from http://storymap.knightlab.com/ or http://mapstory.org/. They are all frameworks for you to create…