OpenRouteService API: A Leaflet example for Isochrones
The page OpenRouteService.org is a very easy to use website which provides routing from A to B via C. It also allows to choose between different routing types for trucks, pedestrians or bicycles and isochrone analyses based on time and distance. In this article I would like to show you, how to embed the OpenRouteSevrice API into your very own Leaflet based webmap.NASA’s Black Marble 2016 or Syrian Dark Years
About four years ago, Daniel wrote a short article on how to publish a GeoTiff as maptiles and how to use this in a leaflet map. I would like to refresh that knowledge and apply this to the current release of the NASA images (“Black Marble 2016”) which were published last week and also compare the images using some LeafletJS magic.Working with Clusters in Leaflet: Increasing Useability
In one of our latest projects we faced a sad truth: geocoding results often sucks and points are not scattered enough but concentrate on distinct locations and clusters will be full of markers. This will lead to heavy clustering if you work with such data in leaflet using the markercluster plugin. In the end it was always hard to find the right point of your interest if you’re facing 20 spiderfied points on one location. So we asked ourself: how can we increase the useability of clusters as we can’t change the location data itself? We came up with a…Isochrones in Webmaps: Three Approaches for Leaflet
As we are thinking more or less specially I always ask myself: where can I be in the next 30 minutes? Most of current webmaps out there are not answering this quite good using isochrones as example. Most of them taking into account the direct distance which have some major implications if you compare the distance of 30min road trip through the countryside compared with the same time in Paris: about 50km against , right? So I would like to show you, how to get a better idea of reachability using three different approaches but all implemented in Leaflet.Geocoding in GIS: ArcGIS, QGIS, Leaflet
The recent move from the Mongolian Post to use W3W as their new address system shed a new light on the question: Where are addresses located and how to get the correct position of an address in your GIS. In this article I would like to show different possibilities in QGIS, ArcGIS and Leaflet. This post references also mappinggis.Filter Leaflet Maps with a Slider
If you create maps you always need to ask yourself: how can I make it as easy as possible to read and still have anything I need in my map… or in short: reduction and abstraction. There are different approaches out there when it comes to web maps. Let me show you how to reduce the number of map elements with a slider in leaflet to filter your data interactively.Python and Webmaps: folium
We have seen some easy ways to create webmaps without learning JavaScript or loosing sort of control of our data in terms of using a platform like cartoDB, mapbox or AGOL (ArcGis OnLine). There are R and QGIS connectors which translates your current data and project to a leaflet or openlayers based webmap. Today I worked with folium which creates a webmap directly from Python. Follow me!Evolving Geographic Information System: OpenWebGIS plans & its crowdfunding campaign
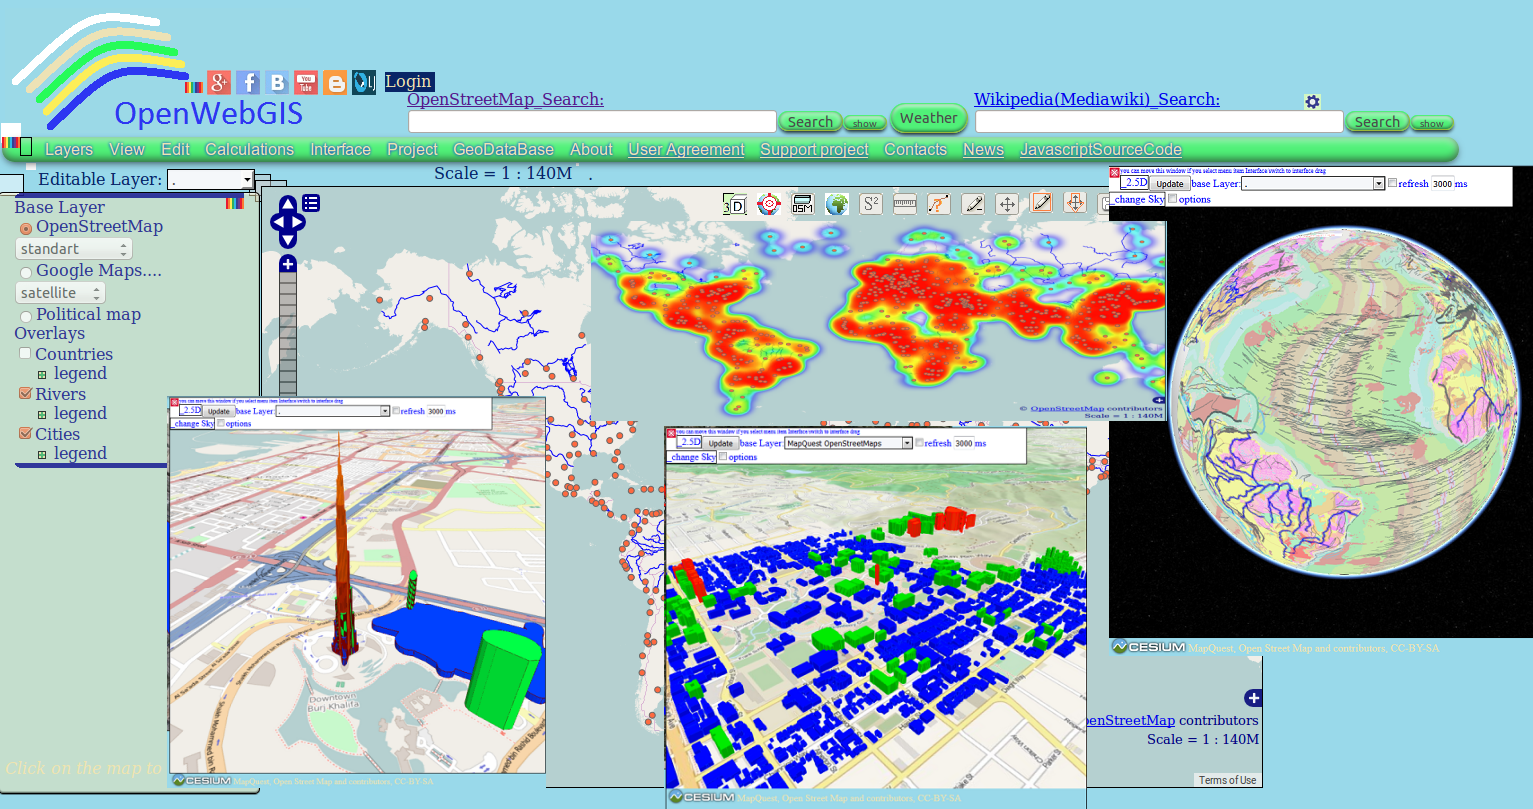
Perhaps you have already used in your work OpenWebGIS or just have seen it or read about it. Due to this system exists since 2014. But we will describe OpenWebGIS briefly. It is an open source online/offline geographic information system for work in web browser or mobile app. Since its foundation, a great number of users have benefited from using this system functions.
Combinig QGIS and leaflet to visualize an area with pictures
The goal of this post is to explain, based on practical examples from my professional activities, how I use QGIS, its plugin photo2Shape and the processing toolbox, together with geospatial packages of R (e.g. the package ‘leaflet’) to exploit efficiently georeferenced pictures.
Webmaps with R: the leaflet package for R
Some months ago I published qgis2leaf which enables a QGIS user to publish a webmap the easy way. It was integrated into qgis2web which offers a leaflet and a openlayers based output for qgis users. But what about R users? Jean-Francois recently published a longer post about GPX tracks and to publish them using some heavy coding. So let’s welcome leaflet for R: an easy leaflet webmap exporter.GPX overview: An R function to create an overview of your .gpx files (using leaflet and RgoogleMaps)
Why GPX? For what? It's convenient to record tracks of your hiking/field trips with the GPS of your smartphone, tablet or just GPS as .gpx files. You can use them to georeference your pictures (for example with the great georefencer of Digikam) or use them for any kind of mapping purpose. I'm mainly using Maverick (and sometimes the Offline Logger ) to do that, Maverick creates files named with the form "2015-08-26 @ 11-31-59.gpx", therefore I'm quickly collecting a large amount of such files.
Short Announcement: Mapbox Directions API with an Upgrade
We recently showed some possibilities to work with routing APIs in QGIS. Besides the Google API and the API from OpenRouteService.org Mapbox also offers some nice routing technology with their Directions API. This was recently updated.CSV to HTML 101 webmap
Alright, away from python scripting, I want to share a small tool CSV to HTML 101 with you, guys. I used VB.NET to develop it in order to help non-GIS experts from converting a CSV file to a web page using leaflet.JS library. Honestly, it’s not that complicated tool, but it gives them that push to start a web map especially if they have not dug that deep in web development, javascript and leaflet. However, I’m one of these people, so please don’t judge my ugly code 😳 The developed tool should meet the following criteria: Simple enough to be used by my grandma.…