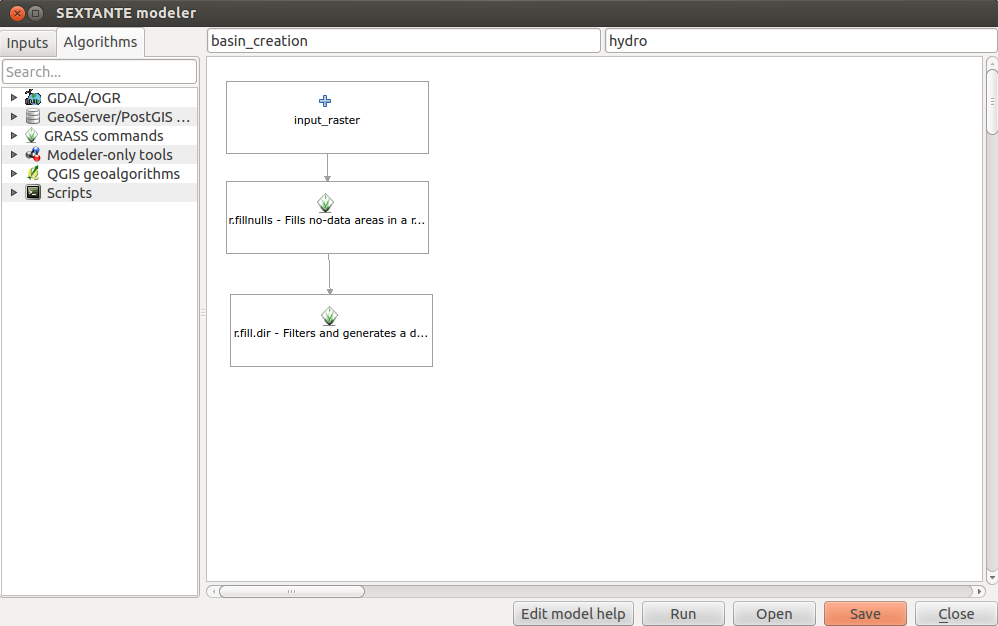
create 3D visualizations: QGIS, GRASS and NVIZ
3D is soooo cool… Okay let’s be honest: the exciting times of Second Life are gone and the Oculus Rift is still not in sight in the end-user stores. But it is and was always cool to create you own 2.5D (we are using GIS not CAD, you know) visualization and make beautiful graphics for your papers or posters. It was always a big drawback for QGIS that ArcGIS was and is so good with ArcScene. But we’re proud users and we’ll use NVIZ. Let me show you how.
30 years of GRASS: a critical birthday comment
Dear GRASS GIS: Happy birthday! There has been a lot movement in the last decades and you enriched our workflows and our way of spatial thinking. There were books written for you , movies filmed for you and you’ve got your very personal encounter with Star Trek:
QGIS plugins: SEXTANTE
SEXTANTE by Victor Olaya is a powerful plugin that bundles many methods and applications from QGIS in one place and provides a GUI for your processing work flow which is comparable with the ArcGIS ModelBuilder or the ERDAS Spatial Modeler. With this plugin it is very easy to use your GRASS, SAGA and GDAL tools, self-written R scripts and many more. This makes spatial analysis much easier and increases reproducibility. Especially the combination with R functions provides a completely new dimension of working with a GIS as nearly everything spatially can be converted to a data.frame and be consumed by…
QGIS Tutorial II: from data to map – preparing data visualisation
In this tutorial I would like to show you, how to create a topographic map and analyse topographical data using freely available SRTM data and QGIS including some data manipulation. This is part one explaining how to get data, remove missing values, explore the relief and changing the color representation of a TIF file obtained by the USGS.