Big-Data: Twitter Visuals
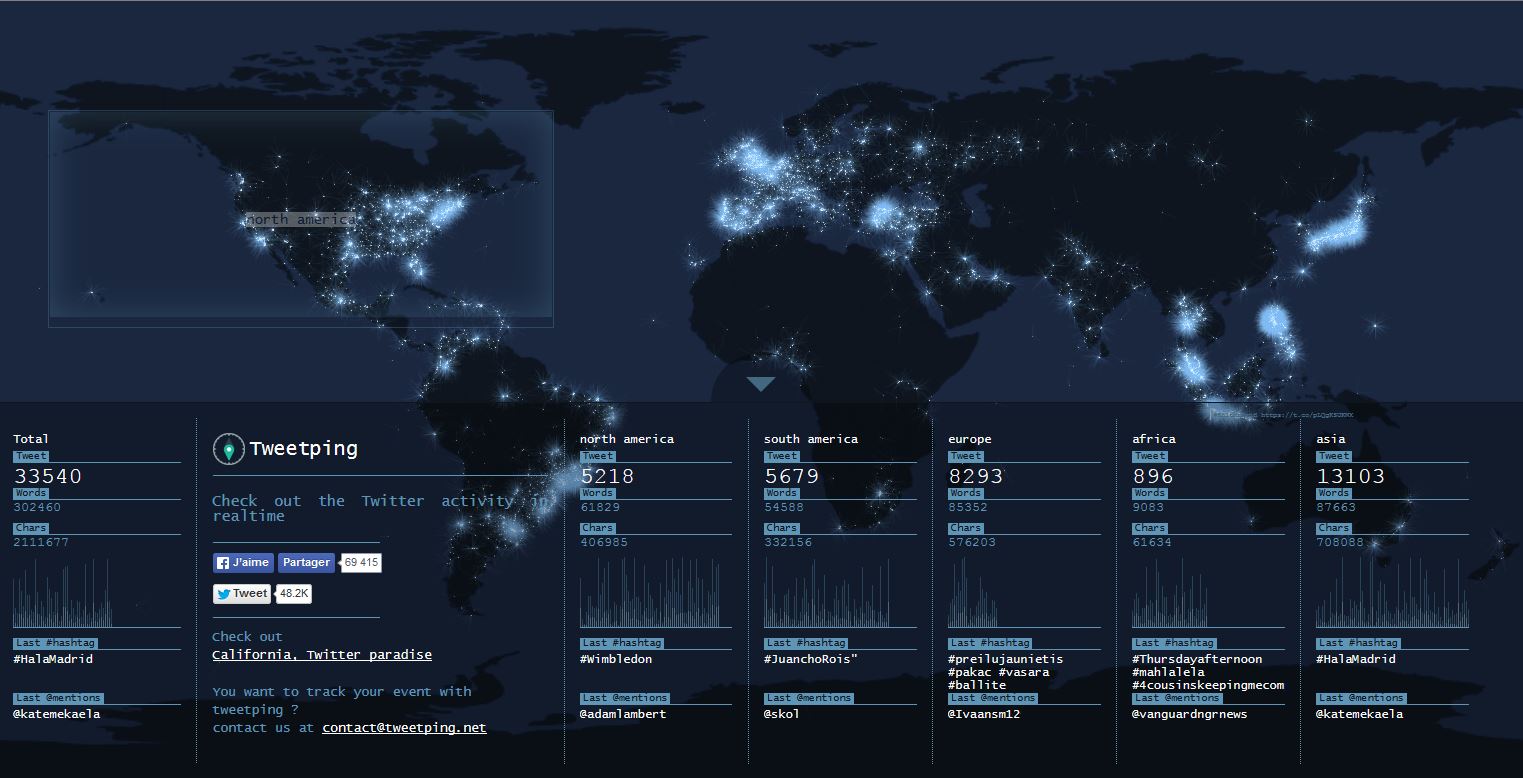
Welcome to the firehose. Every second around 5000 tweets are written all over the world (okay, we can discuss the spatial coverage…) and what could be better as to see the spatial patterns, movement of day and night, the relevance of topics and so on a map? Damn right! Tweetping allows to watch the firehose. The creators of Tweetping also offer the tracking of events. So if you plan an advertisement or other sorts of campaigns: they can follow. A comparable possibility is the usage of the QGIS plugin geotweet to collect tweets for a defined region or for special hashtags.
- Tweetping example
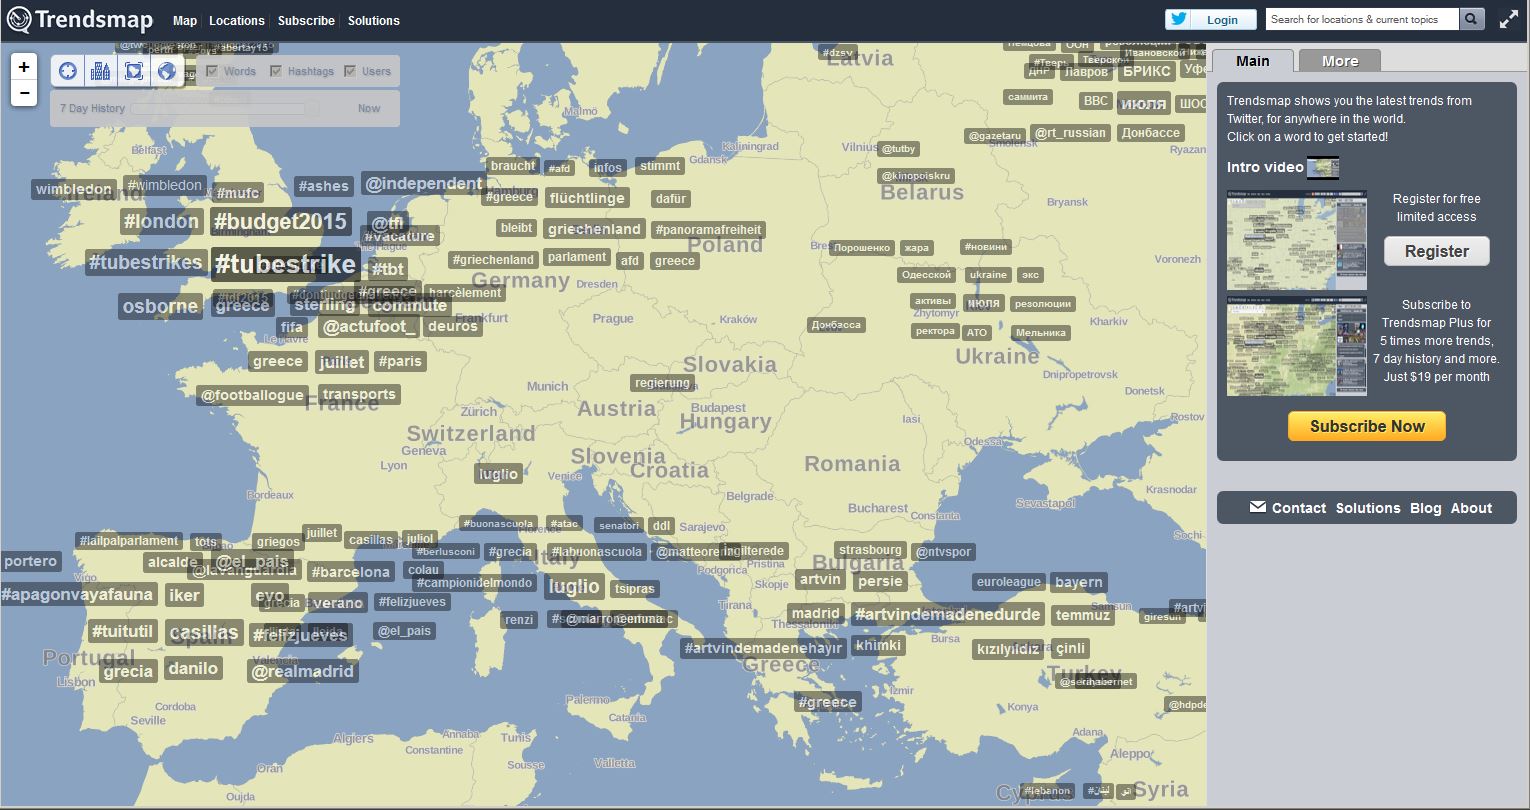
- See more at: http://neomam.com/interactive/trendmap/#sthash.jL3Hf0Ub.dpuf
Big-Data: Mother Earth
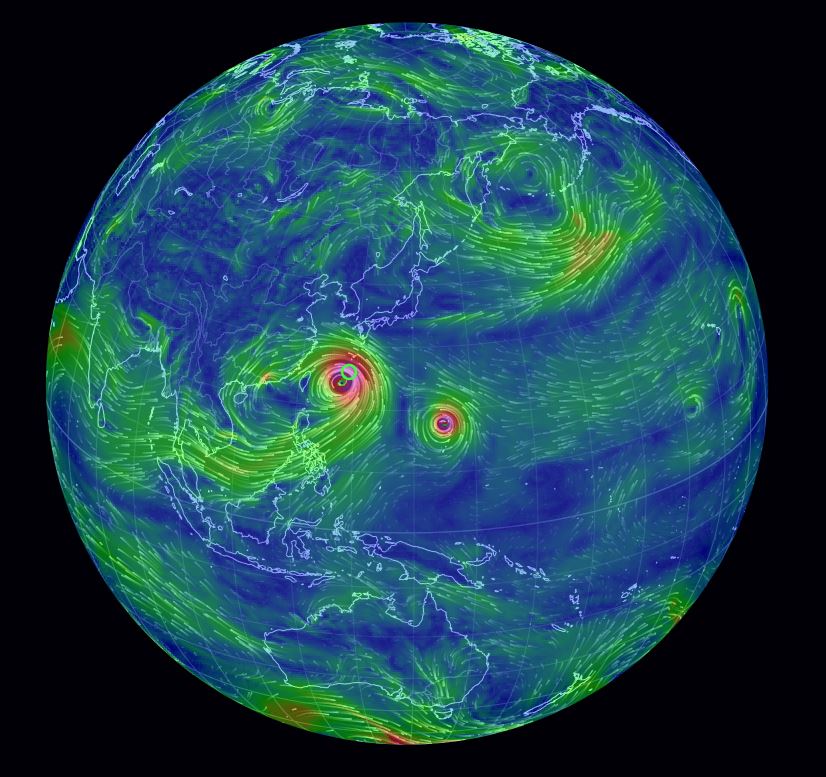
Well let us have look on the natural surrounding of our Twitter and Google users: Mother Earth is monitored heavily and the data is made available using different APIs. Working with those APIs Cameron Beccario from Japan has created a stunning visualization of wind speeds, temperatures, total precipitable water, waves and current ocean streams and many other factors at a global scale. Change different parameters to see jet-streams, Monsoon, Thunderstorms/Hurricanes. Or explore the projection capabilities of D3 (which works behind the vizz)…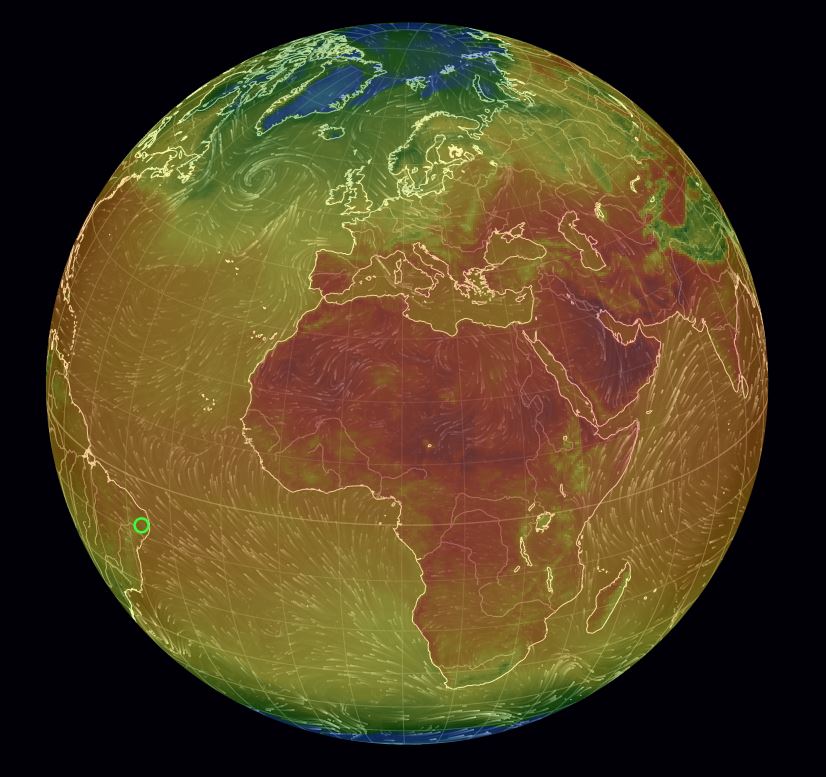


Big-Data: Transport
Knowing current winds is important for modern travelling especially when using an airplane. So it’s no surprise, that there are fewer flights around the above mentioned Typhoons at the moment? How do I know? Well, check flightradar24.com:
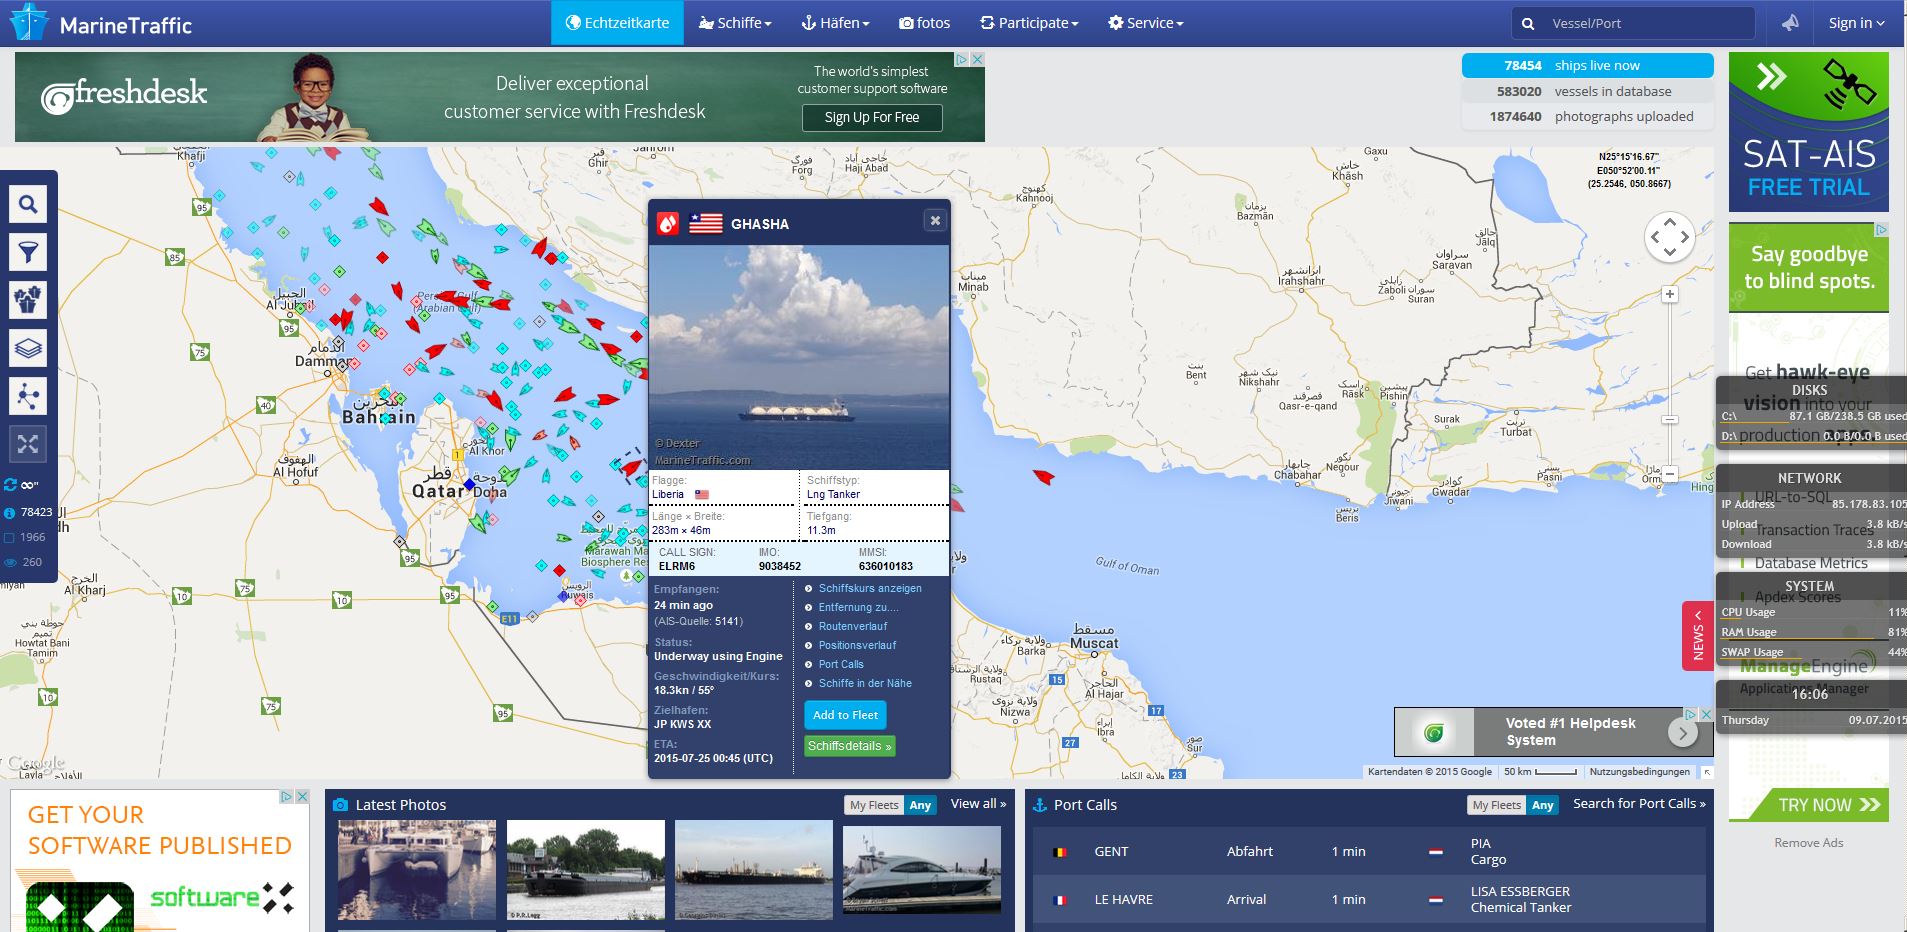
Also busses, trains and other ways of public transport are either equipped with GPS and a transponder or there are other ways to monitor their current locations. If you have it, you can map it, right? And so does travic.com developed by the University of Heidelberg and geOps. You get information about the routes of each line, current position and next stops:
If you want top know how this is done, you should check the page of MTA New York and their GTFS API.
Big-Data: Images/Photos
Current cameras offer the possibility of adding GPS coordinates to images like mobile devices (smart phones) do already. The result is the emerge of millions of geotagged photos all around the world. And one of the most photographed event is probably the sunrise and sunset. Synchronicity uses hashtags #sunset and #sunrise and geotagged images from instagram to map them on three cartodb backuped maps:1) The location/time of #sunset and #sunrise images:
2) The #sunrise images:
3) the #sunset images:
If you’re interested in how a place looks like, whatsthere.co might be a better choice then google maps…Choose your location and get images from instagram that are tagged around this place. Check out Tsetserleg in Mongolia: