Our author Riccardo recently published an article on GeoNet where he described the traffic aware analysis of service areas (isochrones) in ArcGIS Pro with the analytical support of ArcGIS Online. I searched for a way to do something similar in QGIS. So let’s follow the white rabbit.
Where to get the traffic datafrom
Unfortunately I was not able to find an online service that offers traffic aware routing or isochrone analysis based on an open source approach (Do you know any?). Yet you can use openrouteservice.org or graphhopper but the results of isochrone analysis will not take traffic into account.
In the original article it is mentioned that AGOL uses traffic patterns from here so I checked their website. The free tier plan allows you to request their API 15.000 times per month.
You only need to create an app on the developer page and off you go as you only need the appid and an app code to authenticate yourself.
Wrapping it up in Python
I am using the Routing API to get isochrones for 10, 20 and 30min of car travel from Birmingham from them:
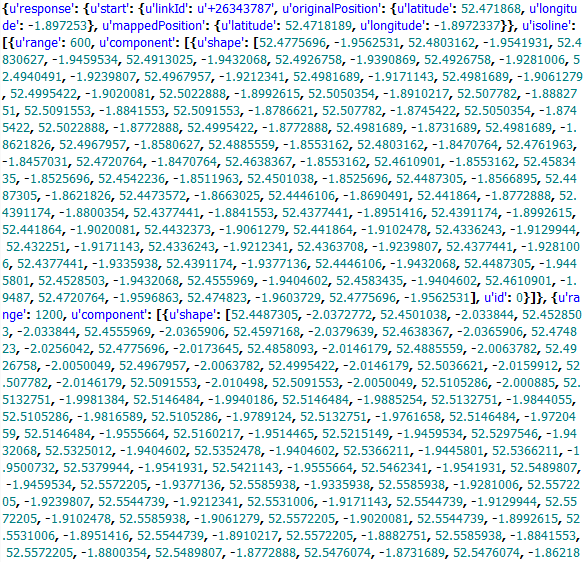
Unfortunately the response from the API is quite “bad” as it gives you a long list of long values:
Yes, just a crazy list of long values. GeoJSON? Just another standard no one wants!
So of course we need to parse them properly and put them in a virtual layer. As I am interested in the areas as well I am using an equal area projection for Europe (I hope this is right?!) with the EPSG 102013.
vl = QgsVectorLayer("Polygon?crs=EPSG:102013", "temporary_polygons", "memory")
pr = vl.dataProvider()
pr.addAttributes([QgsField("time", QVariant.String),
                    QgsField("depart", QVariant.String),
                    QgsField("area", QVariant.Double)])
vl.updateFields()
for polygon in reversed(data['response']['isoline']):
	pointArray = []
	for ind in range(0,len(polygon['component'][0]['shape'])):
		if ind%2 == 1:
			pointArray.append(xform.transform(QgsPoint(polygon['component'][0]['shape'][ind], polygon['component'][0]['shape'][ind-1])))
	#combine to polygon:
	feature = QgsFeature()
	feature.setGeometry(QgsGeometry.fromPolygon([pointArray]))
	feature.setAttributes([polygon['range'], timestamp[0:16], feature.geometry().area()/1000000])
	pr.addFeatures([feature])

QgsMapLayerRegistry.instance().addMapLayer(vl)
Now you can see we have all the ingredients to make a nice loop using different departure times and to get a nice analysis for the places that can be reached in a given time for different departure times throughout the day with traffic patterns in mind.
If we want to determine “real” commuting patterns you can also switch from departure to arrival (as noted in the API documentation) so you can model the patterns even better. But the presentation of your results might be best using the timeManager plugin from Anita. The result of a looped analysis throughout a day might look like this if you apply some style-magic: traffic enhanced isochrones during a friday in Birmingham
You can download the script for the API calls and add your own app credentials.
Is there a way you can alter this script so that it creates a downloaded json file that can be brought into the likes of QGIS?
Stadler Reini
6 years ago
Hi, first of all thank you for the great tutorial. With the help of a friend that knows coding I managed to clear most of the steps listed. I got the API, I managed to run the first part of your code and get the response from the API using Python in Qgis. However, after I paste the second part of your code into the Python of Qgis i get an error: File “”, line 11 QgsMapLayerRegistry.instance().addMapLayer(vl) ^ SyntaxError: invalid syntax where line 11 is: pointArray.append(xform.transform(QgsPoint(polygon[‘component’][0][‘shape’][ind], polygon[‘component’][0][‘shape’][ind-1]))) Do you have any idea from what it comes? We spent like 2… Read more »
Using the API script from the end of your tutorial I managed to get the shapes. Thank you very much!
Brylie Christopher Oxley
6 years ago
Hello, and thanks for this interesting tutorial!
Would you mind adding a license header to your script (or even sharing it on GitHub), so we know what permissions we have regarding its use/redistribution? By default, it is covered by the full extent of Copyright, which means we are not allowed to modify or share the work.
Most of GIS users today will probably work with ArcGIS. Since version 10 the implementation / integration of Python into the ArcGIS framework and ArcPy it’s important for…
So I came across this nice little project which focussed on trip planning and route over large distances… And there was this nice little post from Nathan Yau…
GeoPandas, once installed, supports you with a handfull of GIS functions in your Python notebooks and will leverage your work with geospatial data. But to be honest: this…
When working with GIS and statistical data there is an emerging need to know some scripting language. Python is one of the most widely used. It is not…
 You only need to create an app on the developer page and off you go as you only need the appid and an app code to authenticate yourself.

Is there a way you can alter this script so that it creates a downloaded json file that can be brought into the likes of QGIS?
Hi, first of all thank you for the great tutorial. With the help of a friend that knows coding I managed to clear most of the steps listed. I got the API, I managed to run the first part of your code and get the response from the API using Python in Qgis. However, after I paste the second part of your code into the Python of Qgis i get an error: File “”, line 11 QgsMapLayerRegistry.instance().addMapLayer(vl) ^ SyntaxError: invalid syntax where line 11 is: pointArray.append(xform.transform(QgsPoint(polygon[‘component’][0][‘shape’][ind], polygon[‘component’][0][‘shape’][ind-1]))) Do you have any idea from what it comes? We spent like 2… Read more »
Using the API script from the end of your tutorial I managed to get the shapes. Thank you very much!
Hello, and thanks for this interesting tutorial!
Would you mind adding a license header to your script (or even sharing it on GitHub), so we know what permissions we have regarding its use/redistribution? By default, it is covered by the full extent of Copyright, which means we are not allowed to modify or share the work.
you can access the script here: https://github.com/davidribbon/heartbeat