The geodata department of the city of Berlin offers a great portfolio of free geodata for everyone to use. One dataset is the result of some LIDAR measurements and is offered as a txt with x,y and d values. This is commonly known as xyz data but should not be mistaken as a simple whatever-delimited text file. This dataset is regular spaced and therefore can be threatened easily with QGIS. But let me first show you some interpolation results which can be produced as well.
Interpolational madness
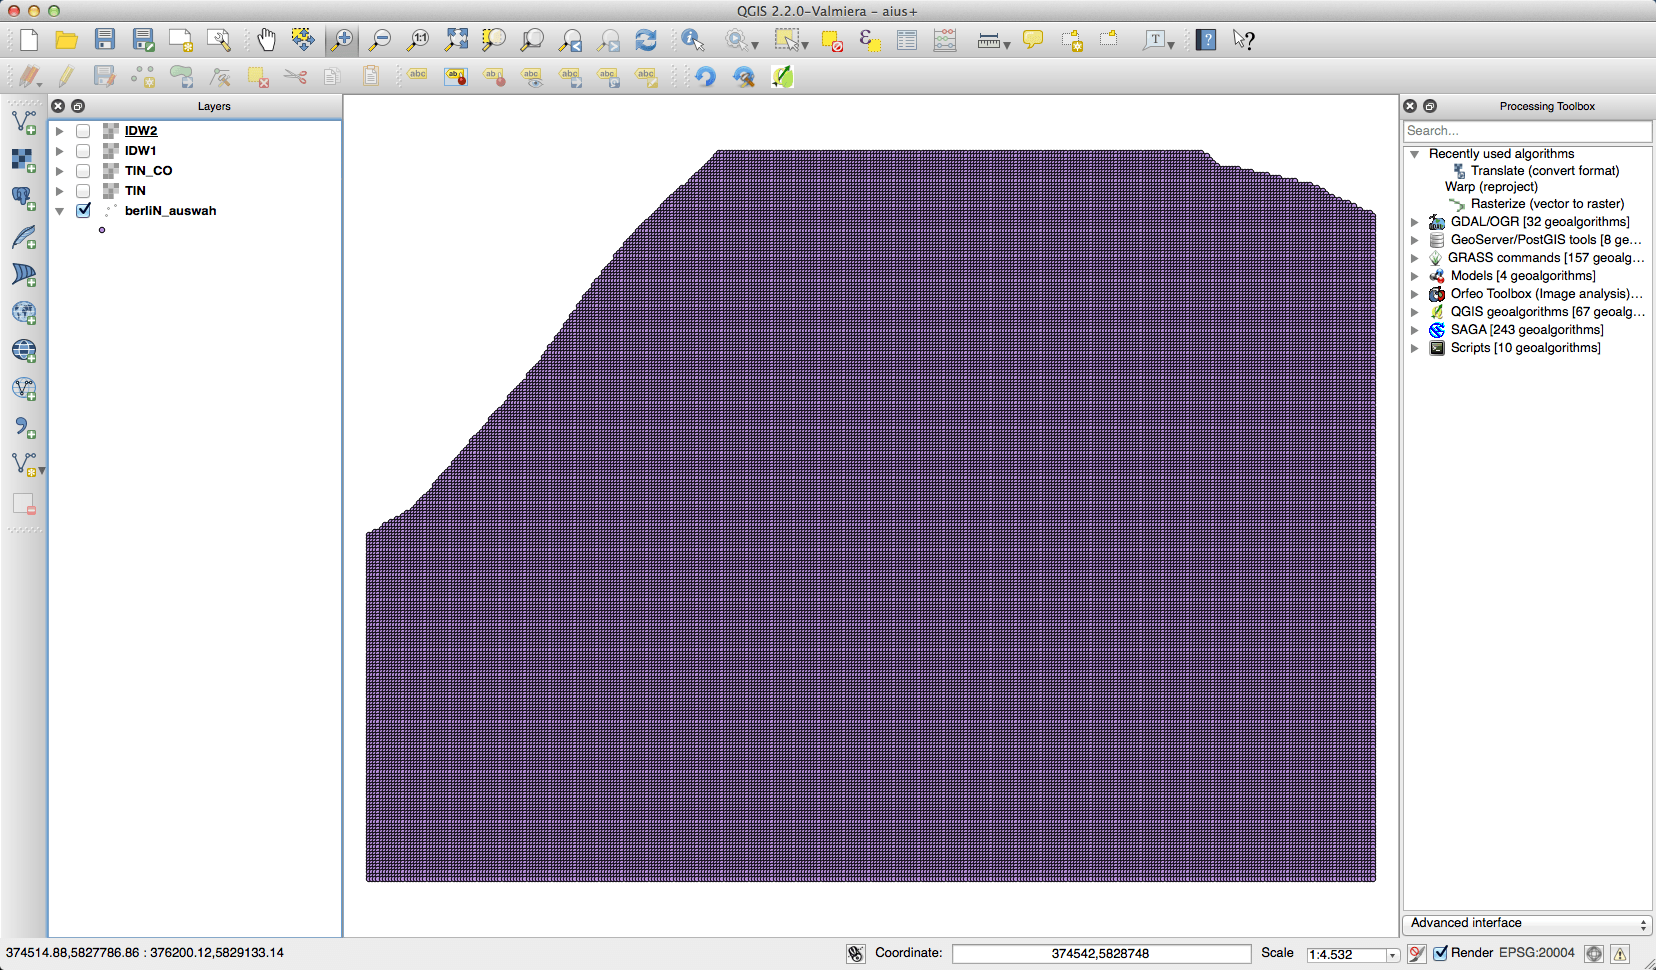
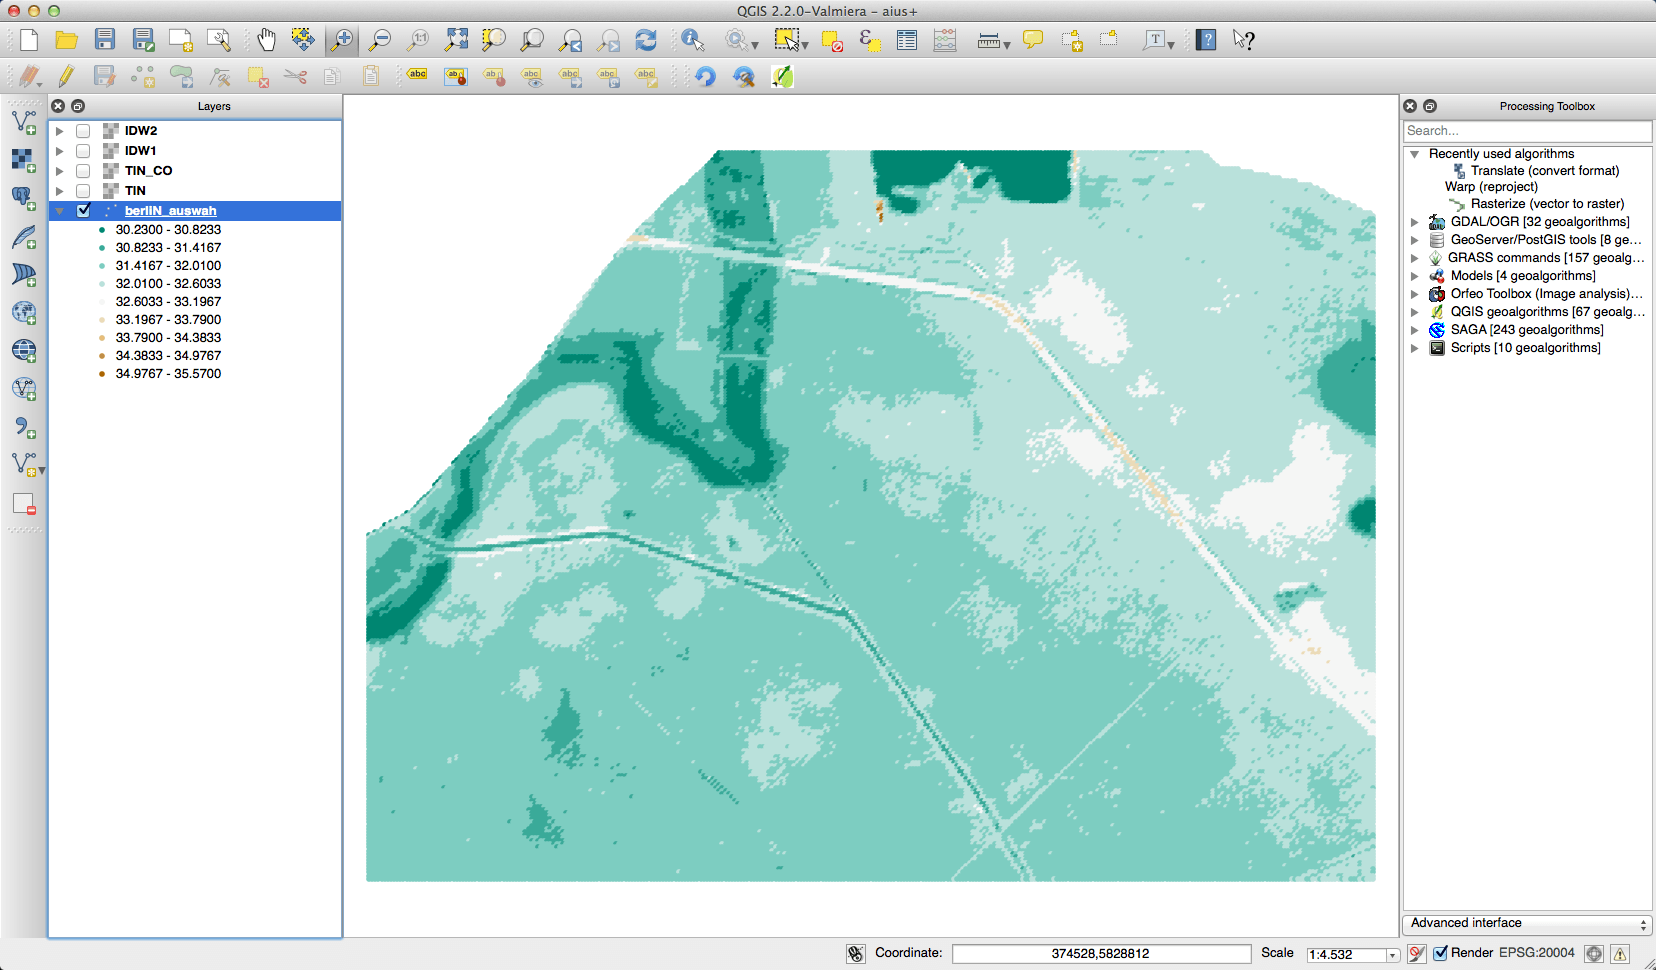
If you want to create raster data from a point shapefile or a list of coordinates you normally think in the direction of TINs, IDW, kriging, and other more or less advanced interpolation techniques. QGIS offers TIN and IDW out of the box. As I was afraid to select the whole 2.5GB point shapefile as input, I’ve tried with a small subset of points. But first: what does the data look like?
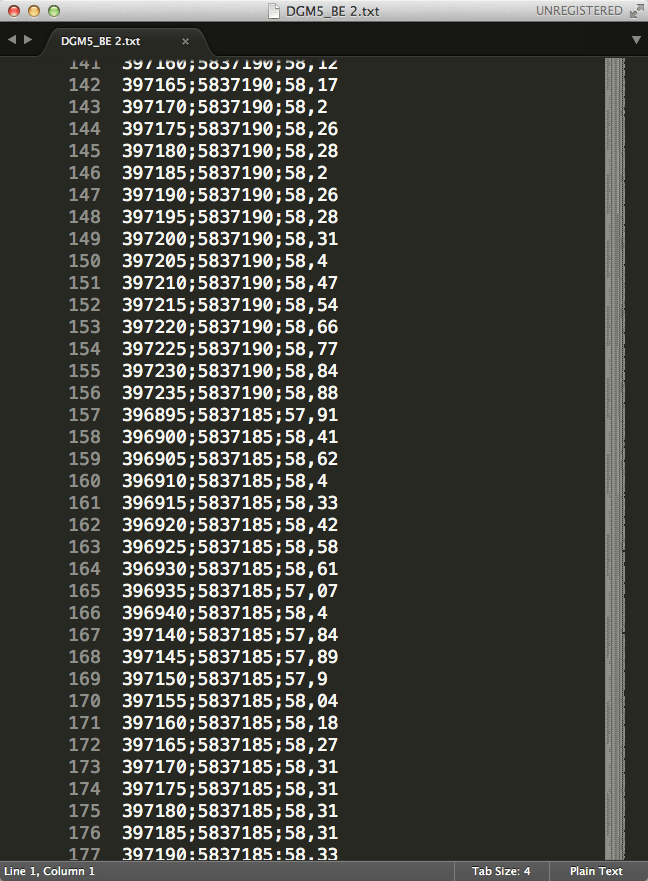
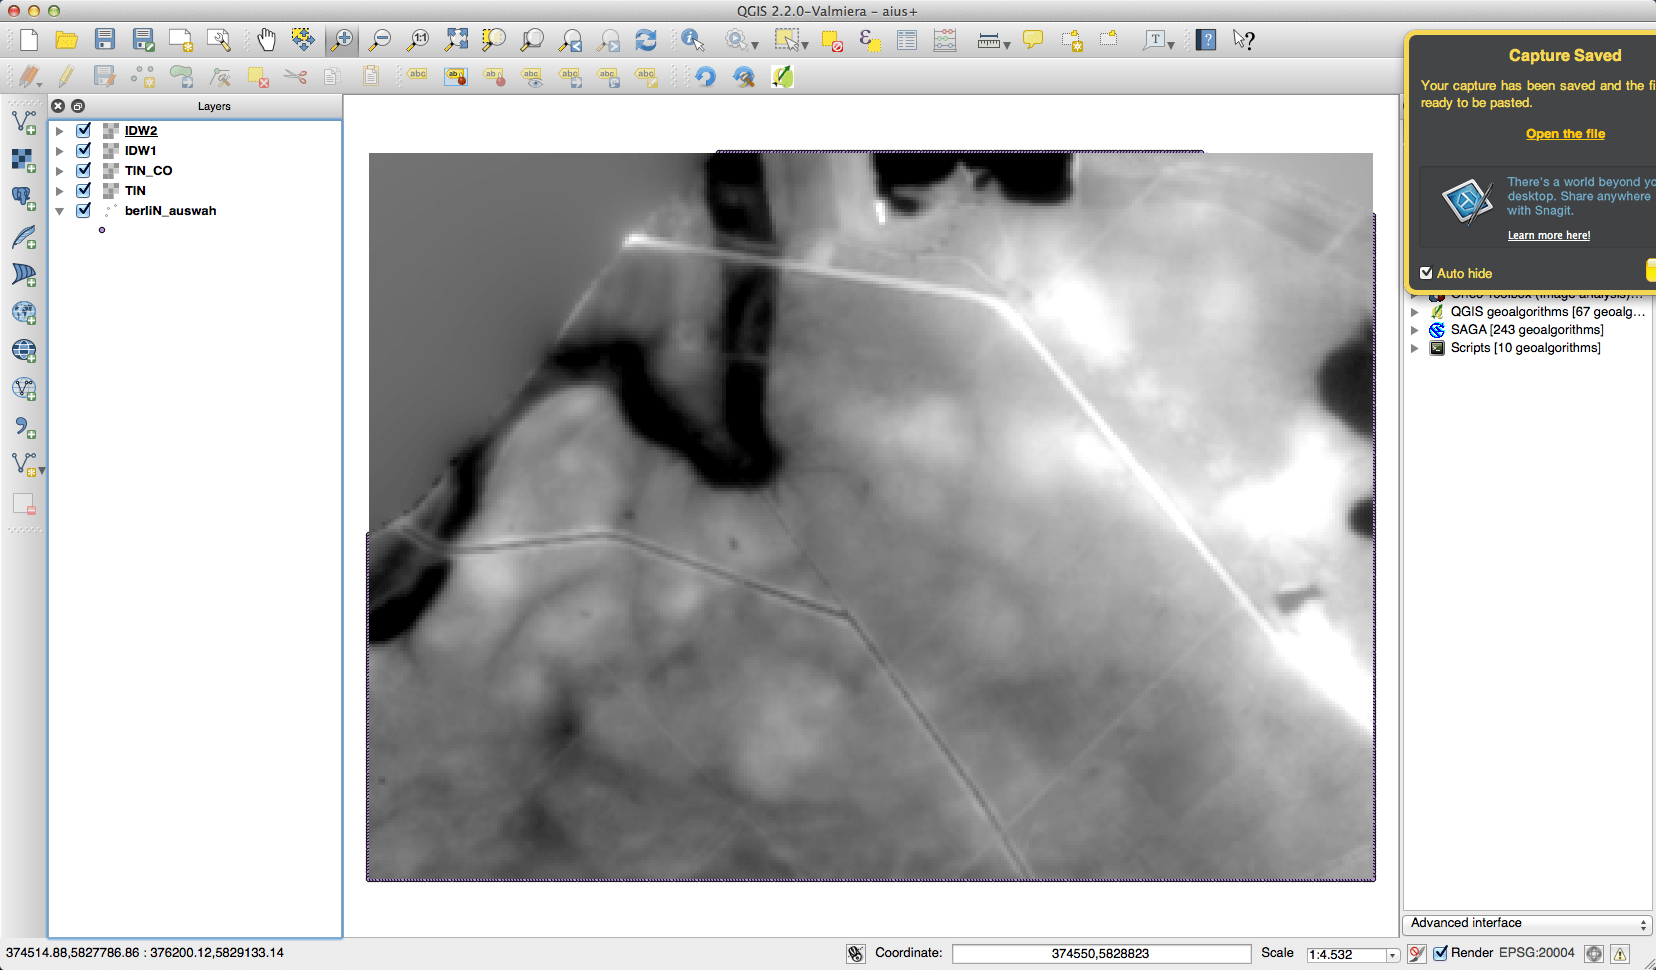
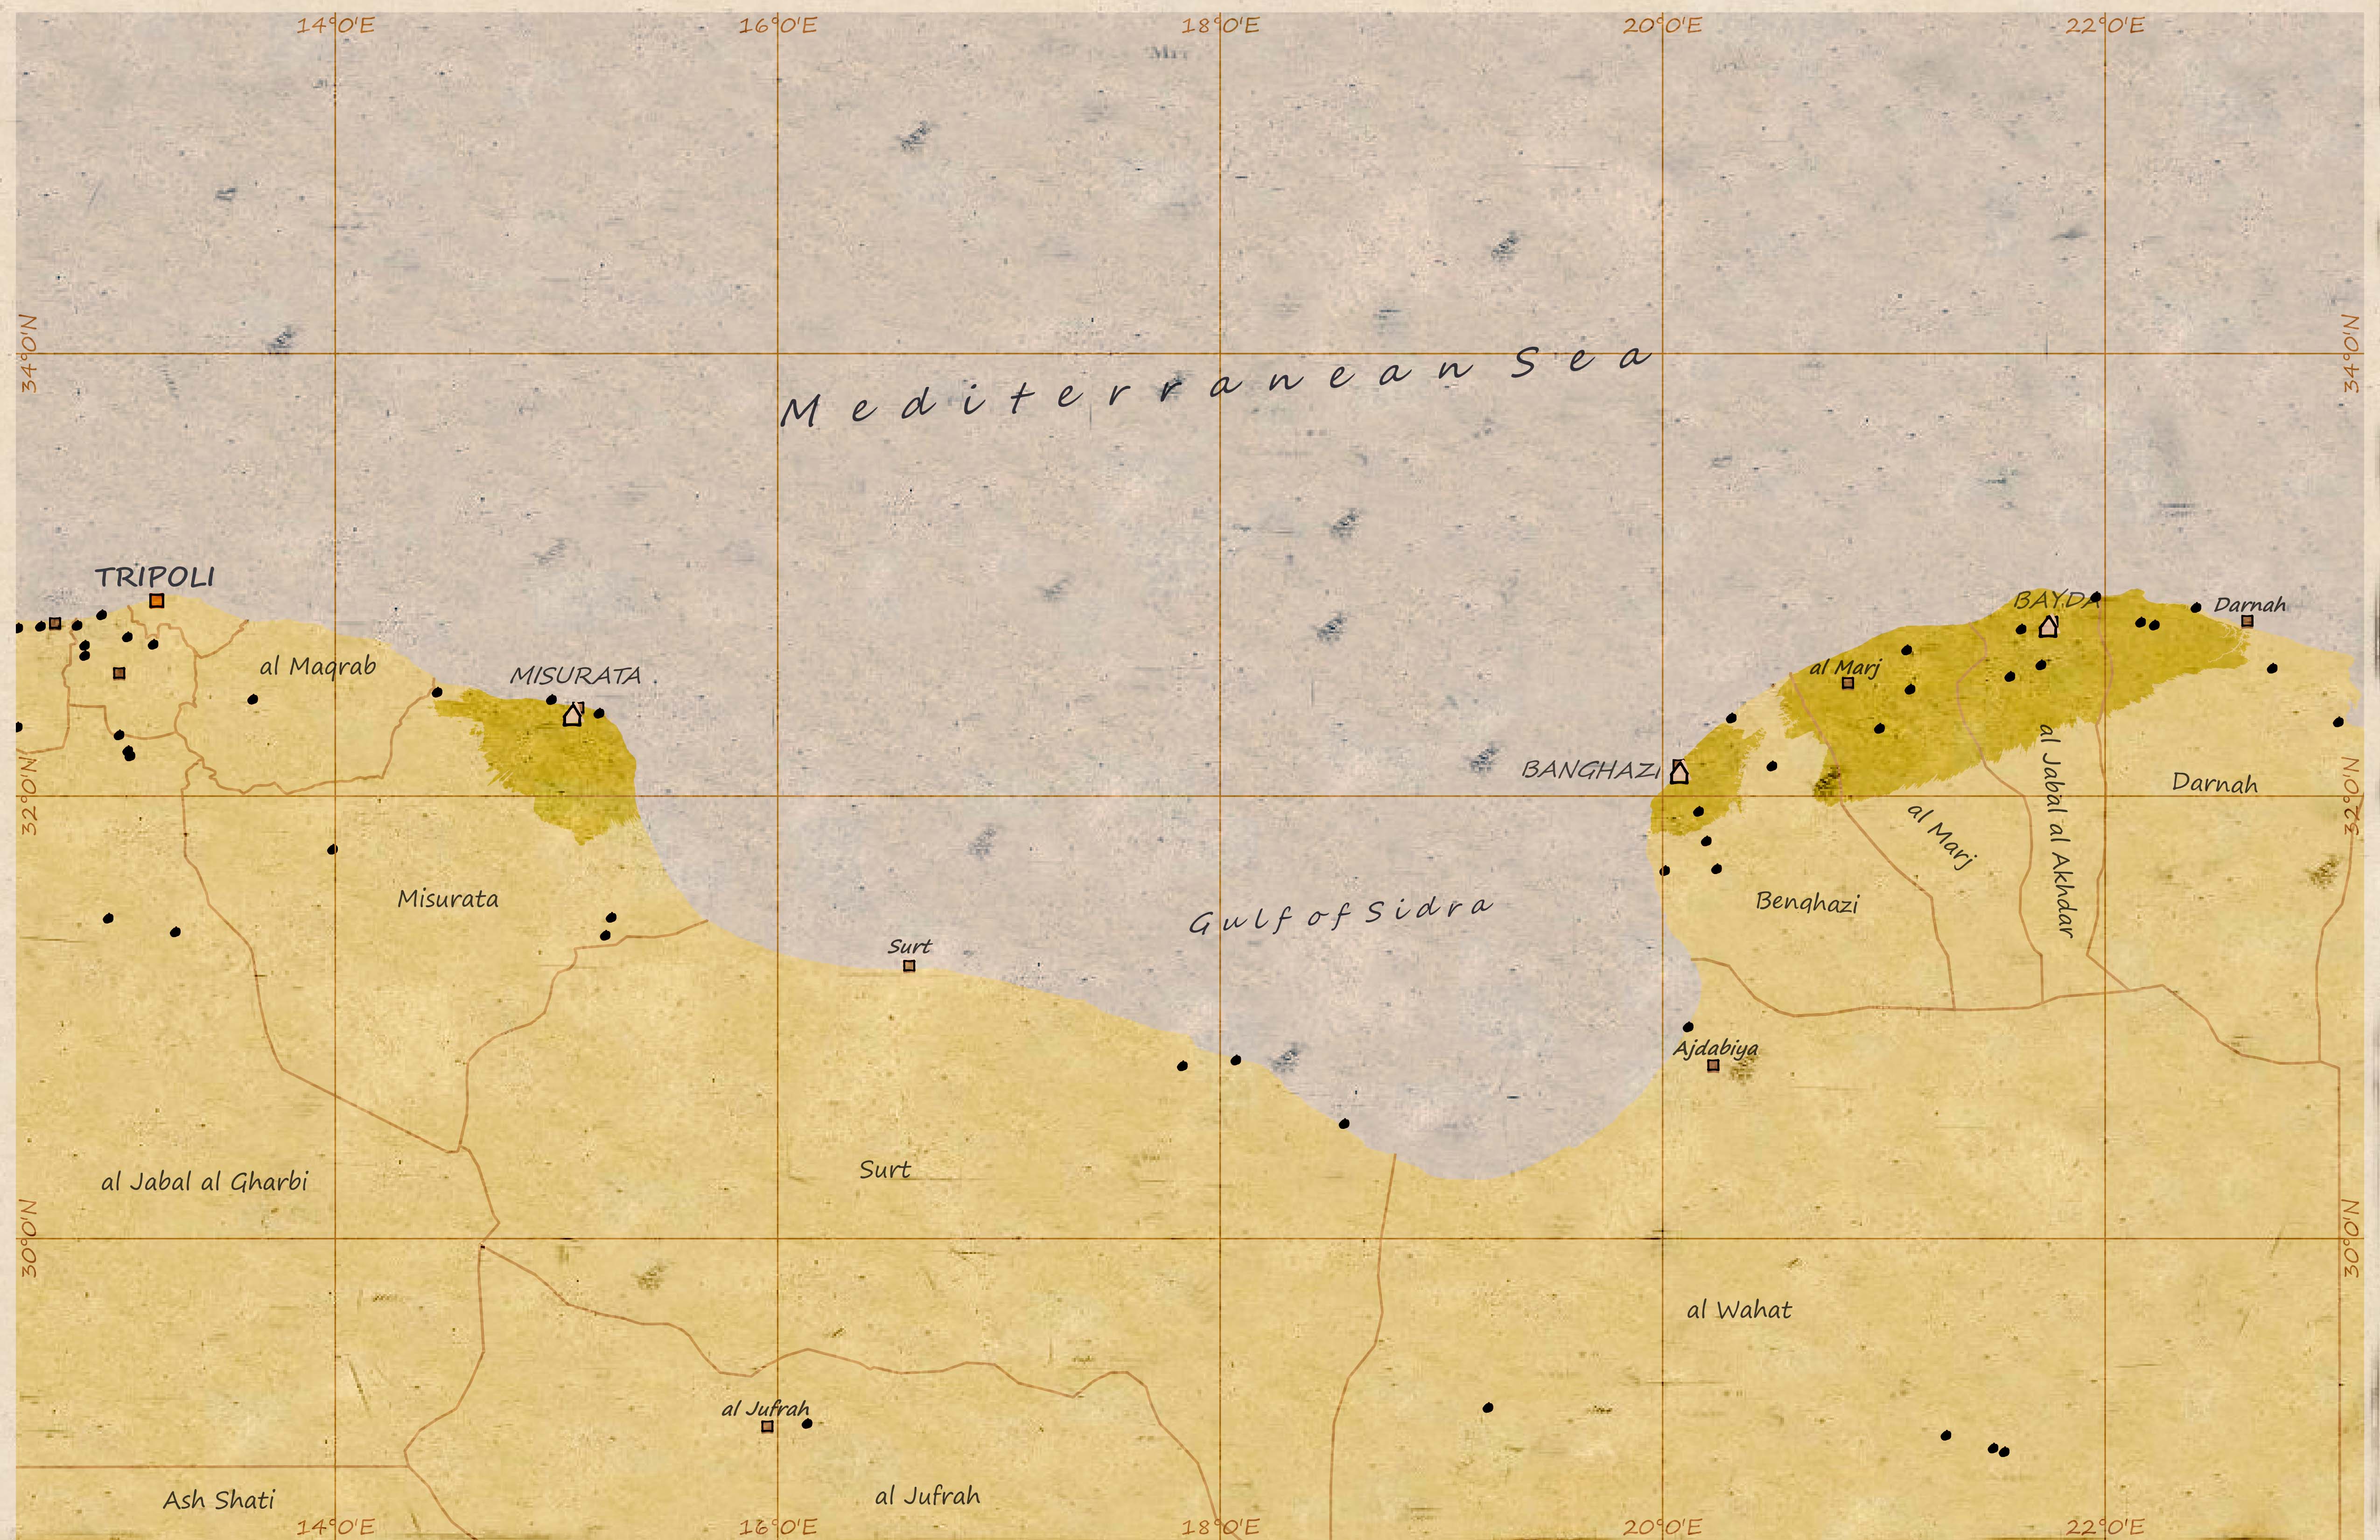
Looking at it I was frightened… 35.000.000 data points. How can I convert it to a raster using my Mac and not this beautiful Tianhe-2? This is what it looks ones it is loaded into QGIS:
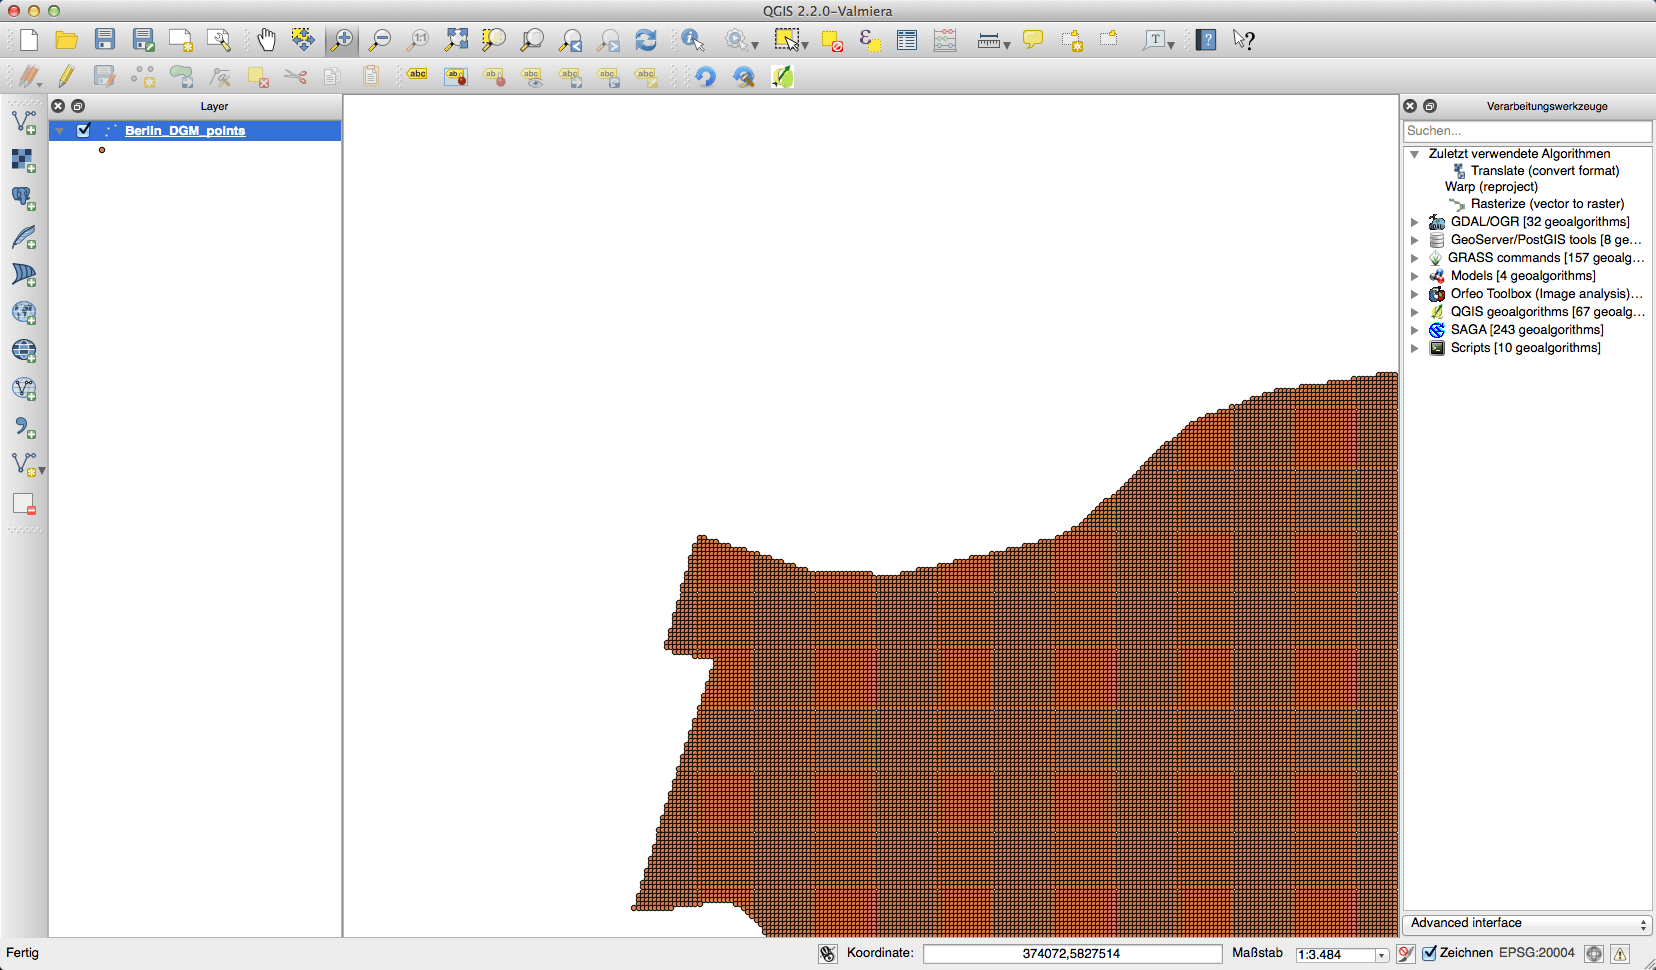
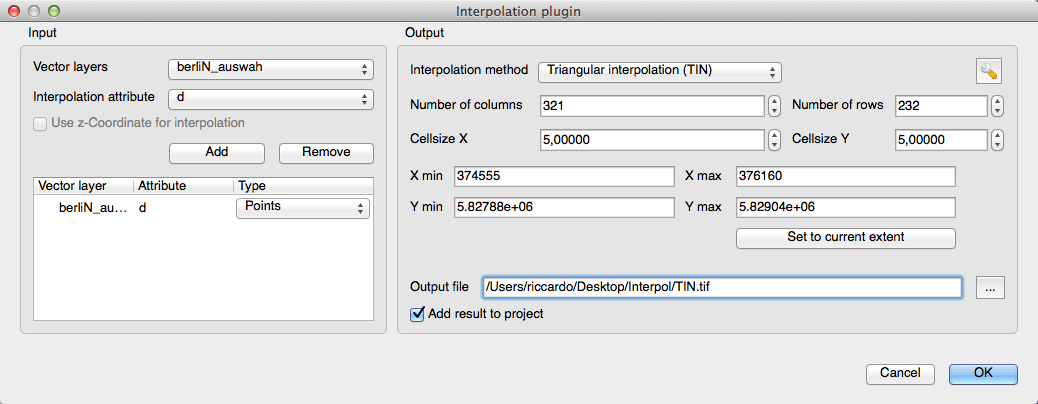
I was sure that interpolating this amount of data was a problem. My first try was done with a small subset. The interpolation methods IDW (inverse distance weighted) and TIN (triangulated irregular network) are placed under Raster->Interpolation after you’ve added the Interpolation plugin which is shipped with QGIS. As this workflow is not correct I’ll just show you some results for this small subset:

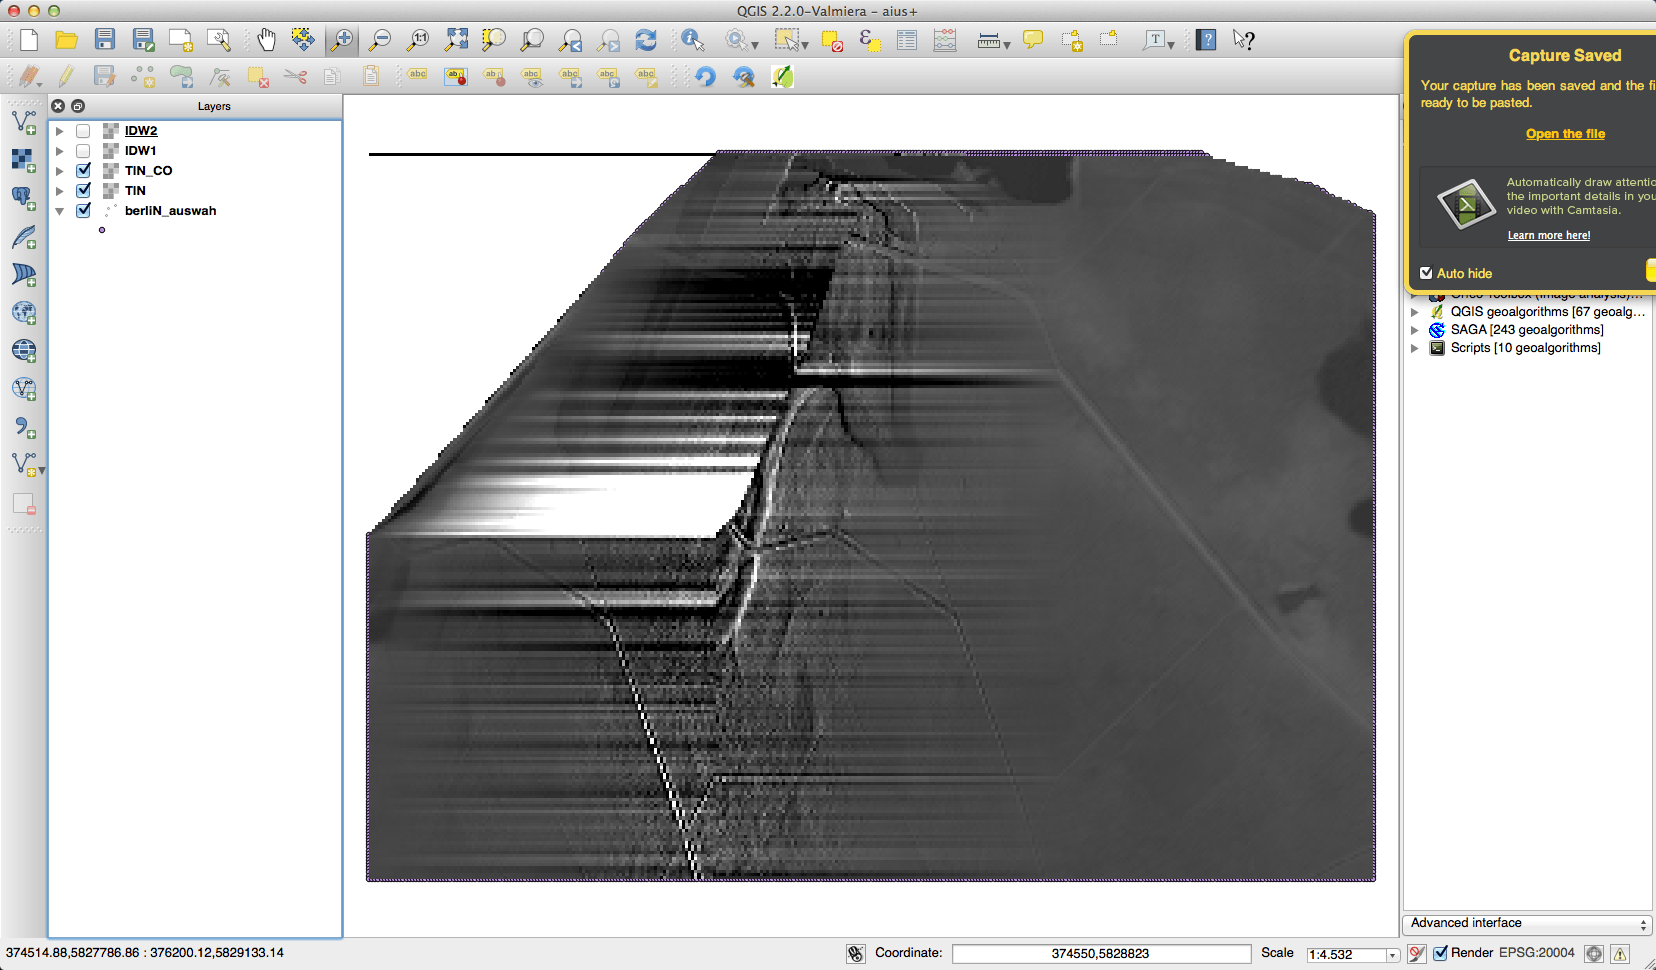
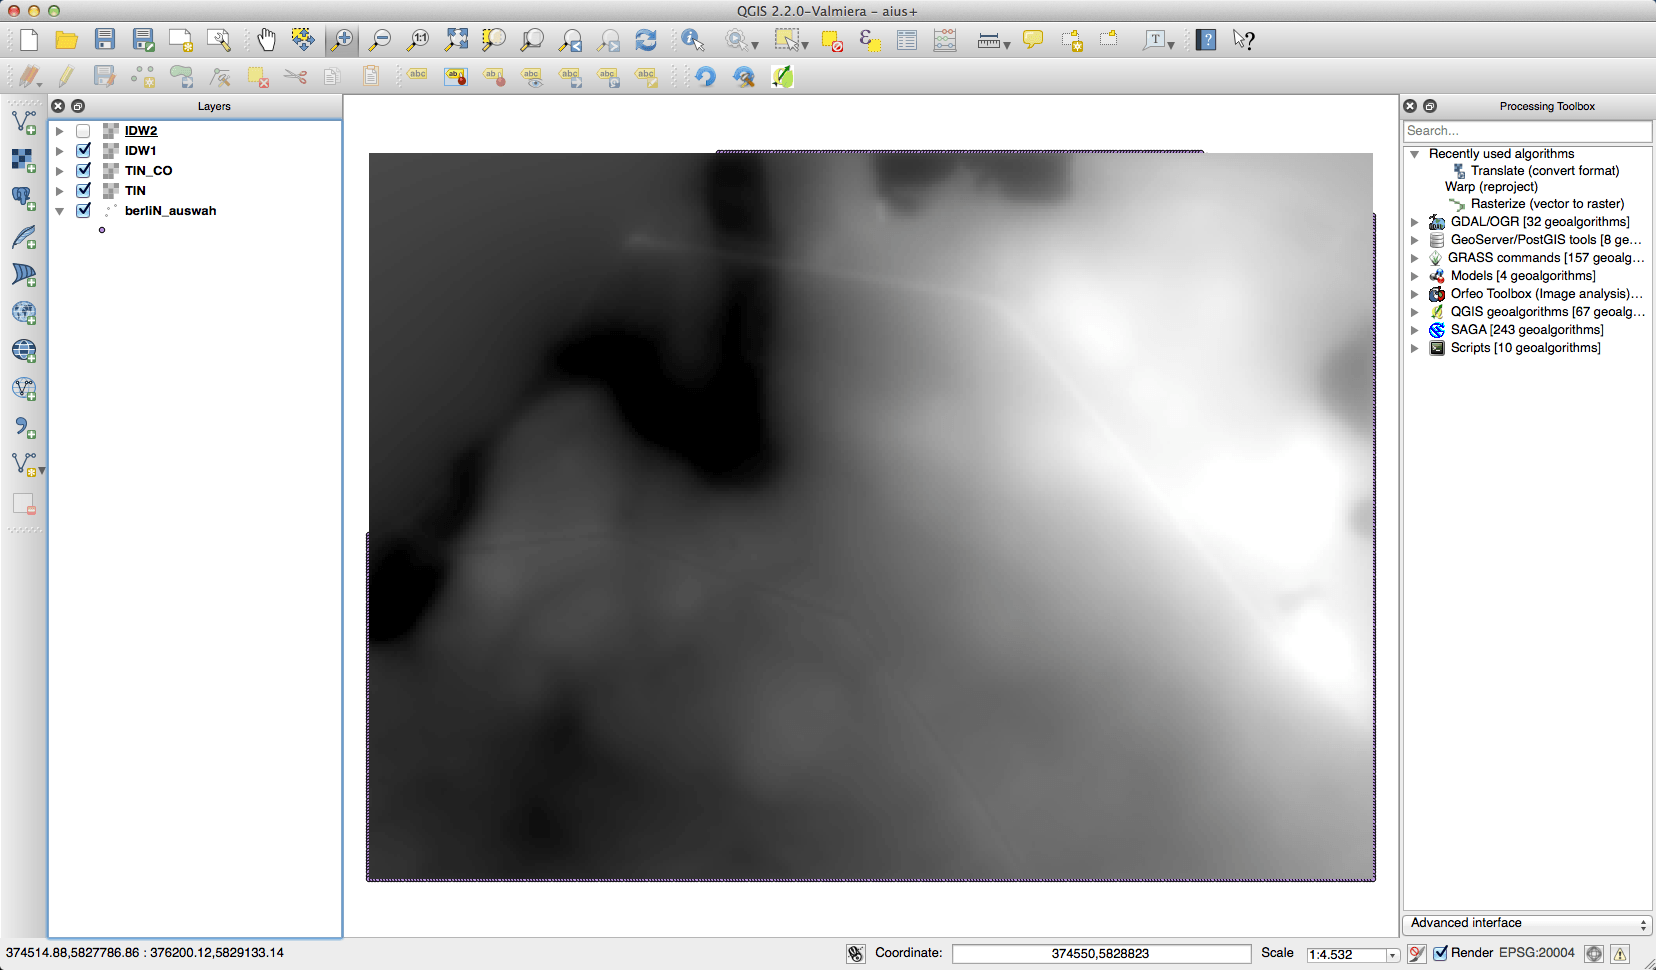
The IDW looked best to me, but it was also very lame in computing. And thinking about it once more: I don’t need to interpolate!
Grids are your friend
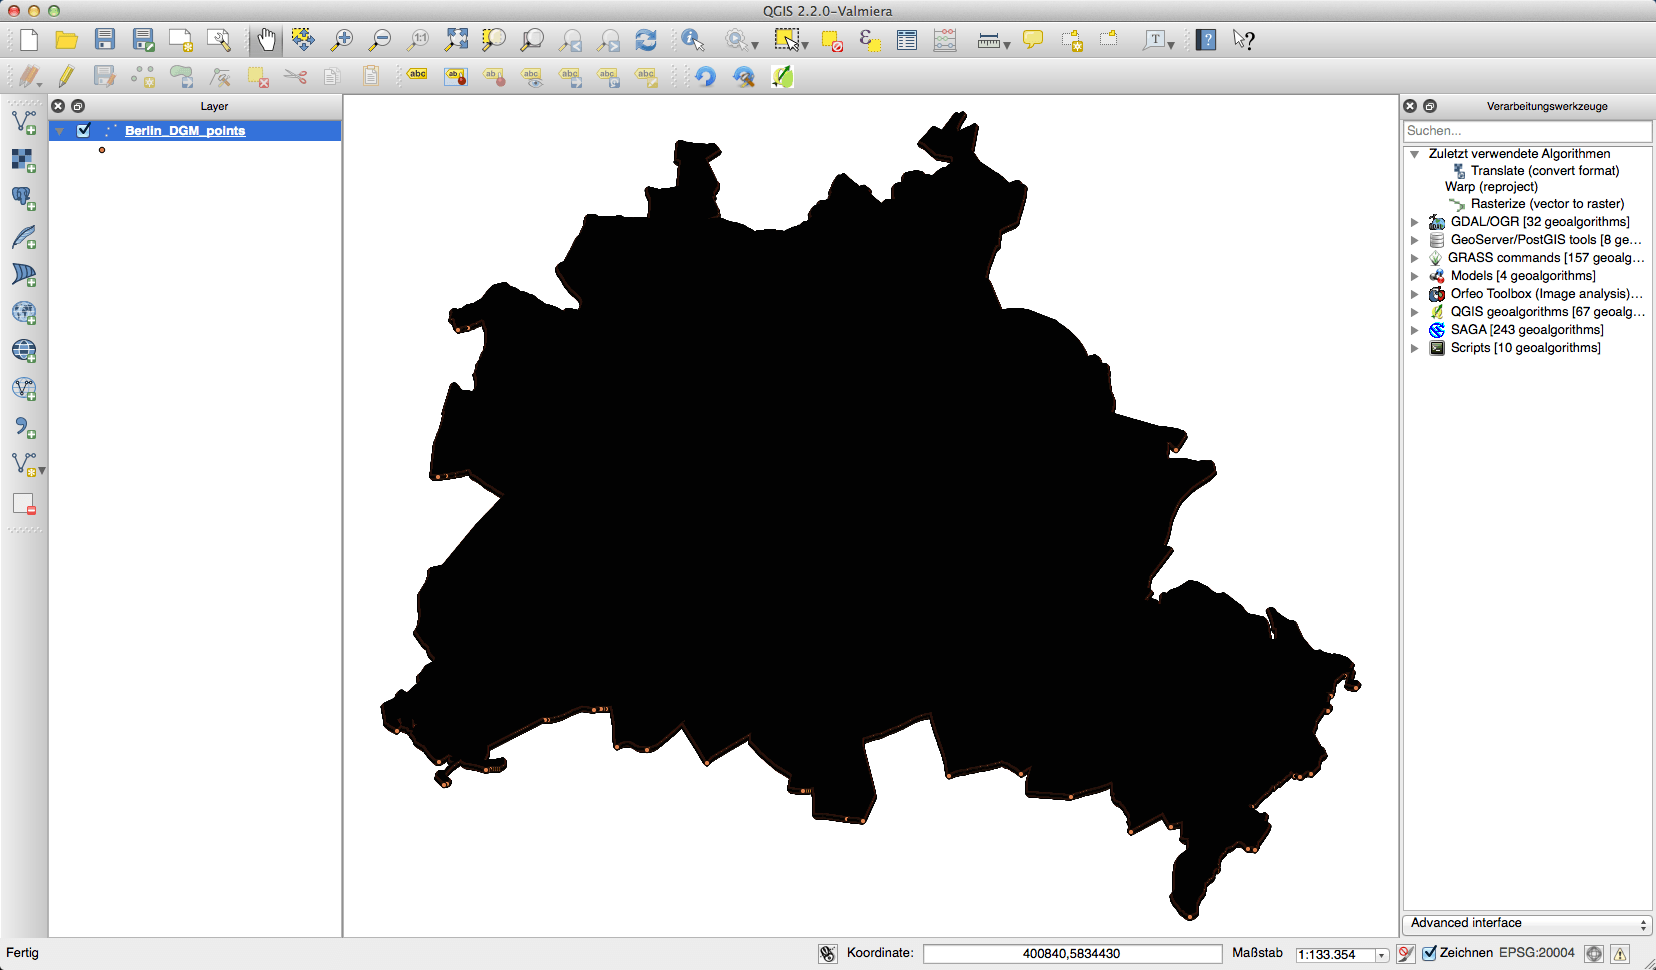
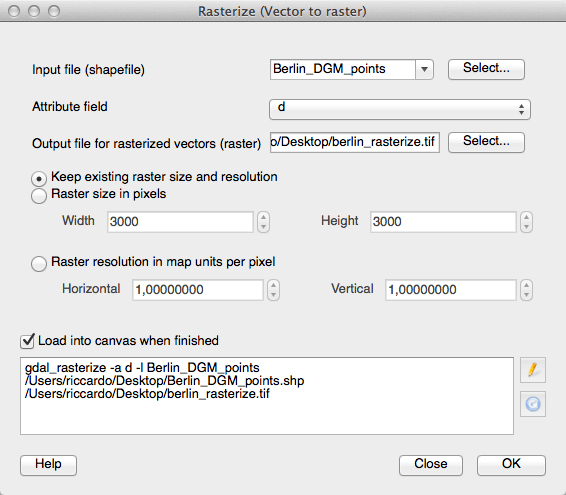
So I’ve searched the web and gis.stackexchange.com was once again my friend. Once you’ve added your points to QGIS go to Raster->Conversion->Rasterize an fill in the parameters you think are right:
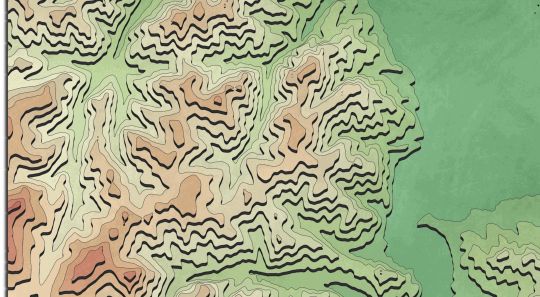
And the results for the subset were created fast and they look much better than the IDW method which took much longer:
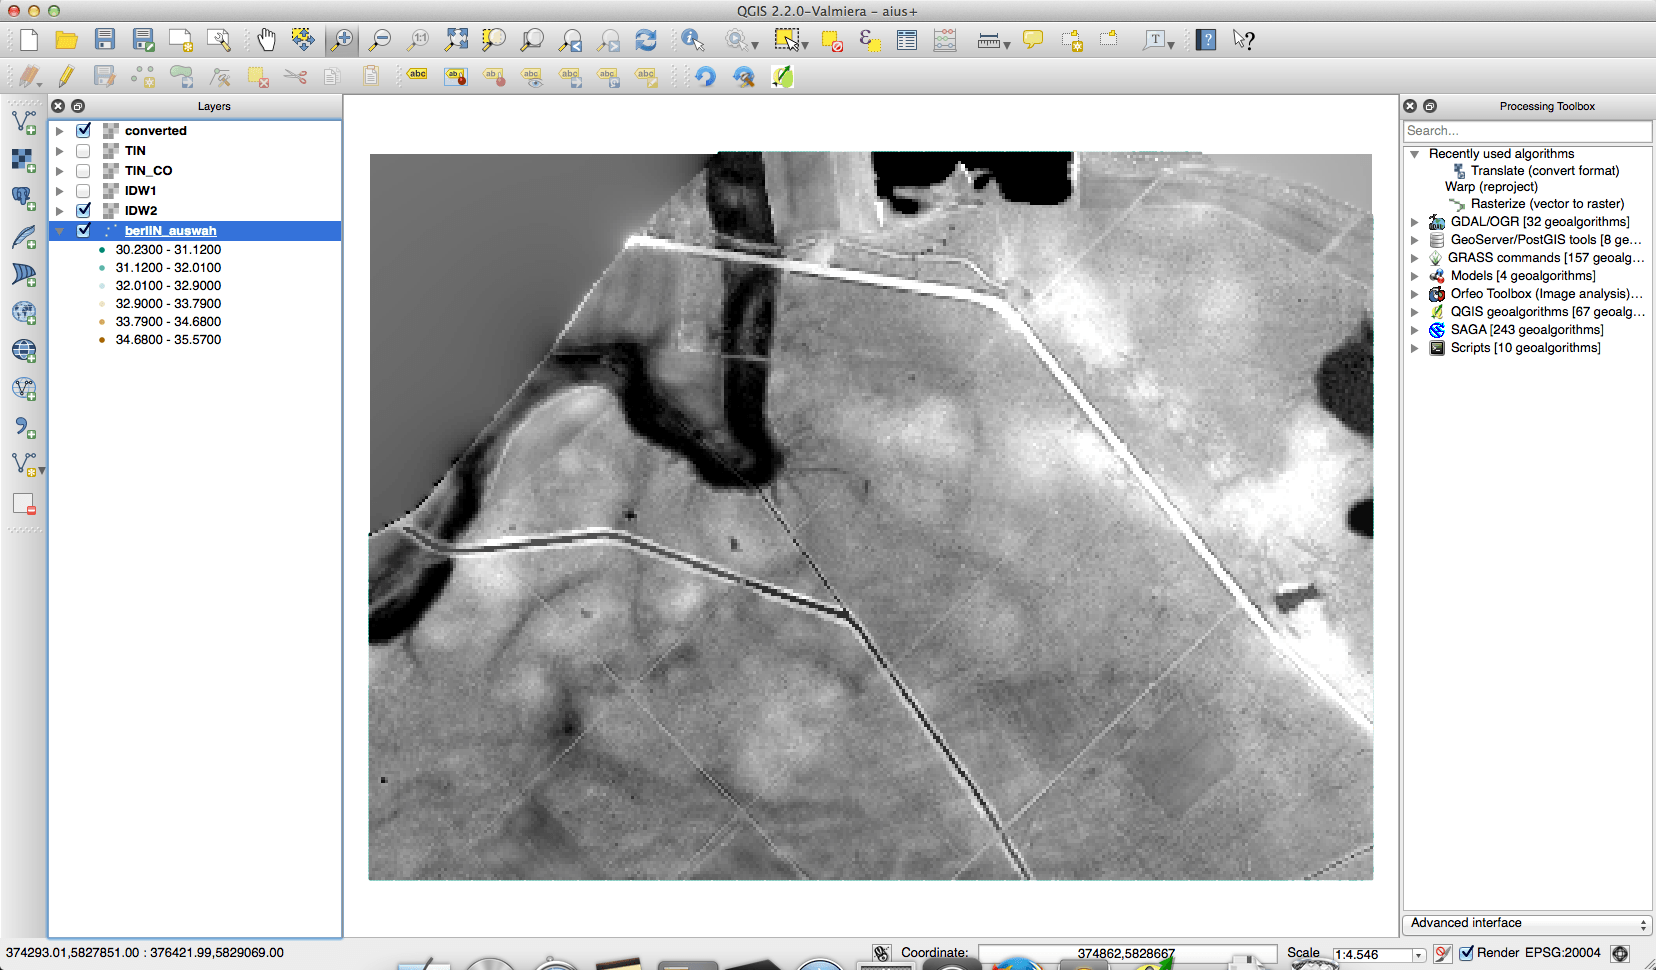
I’ve learned: keep it simple to get best results 😉

I must admit I cannot follow you. Can you please explain the steps you took from the raw file (list of points) to a shapefile suitable for being used with the Rasterize plug-in? Also please reference the specific data source – I am not sure if you actually used the “ATKIS® Basis-DGM (2m-Rasterweite)” dataset: http://fbinter.stadt-berlin.de/fb/index.jsp?loginkey=showMap&mapId=k_dgm5@senstadt
PING
@disqus_Sq3X3rzFfa:disqus: maybe you can give a short answer on @tbsprs:disqus question?
[…] Click to view slideshow. […]