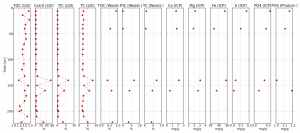
Today I want to share a Python script that I wrote to plot some lab data against the core depth it was taken from. I know its not very special if you are a Python guru, but I know that many students and scientists have problems to visualize their data in a proper way. My idea was to collect some ideas and developers who are interested to test and to enhance the script. Also, I want it to be open source, so feel free to fork it on GitHub or give feedback.
The usage is not that easy at the moment, as you have to install python and the dependencies manually and go through the script to change my custom parameters.
Simplified, you provide an Excel spreadsheet, and tell the script which columns are the data rows and which is the depth column. The Subplots are adjusted manually, too.
If you have any ideas about this or want to help, feel free to ask for further instructions.