ArcGIS REST API and QGIS: a practical example
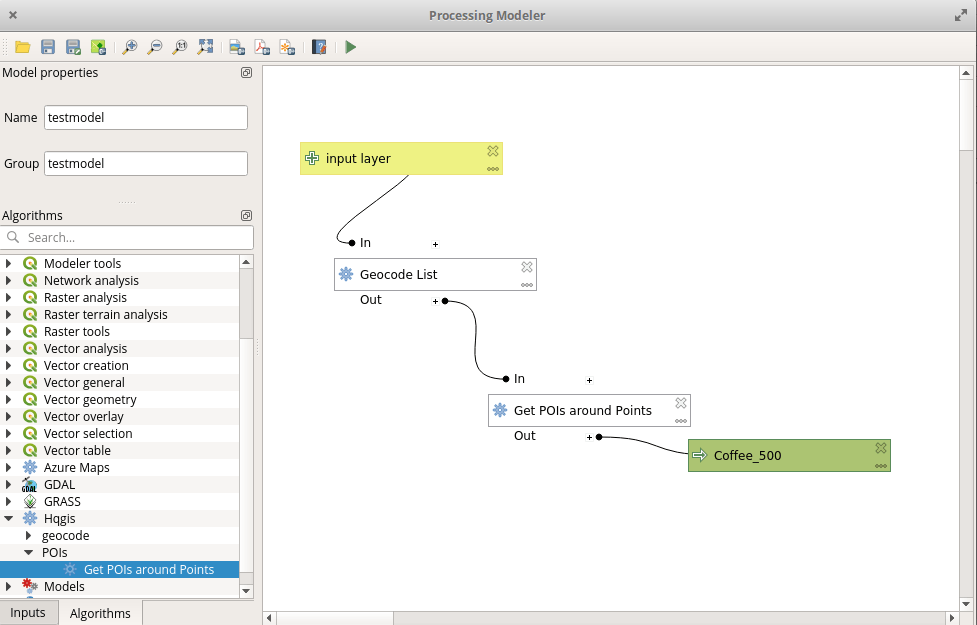
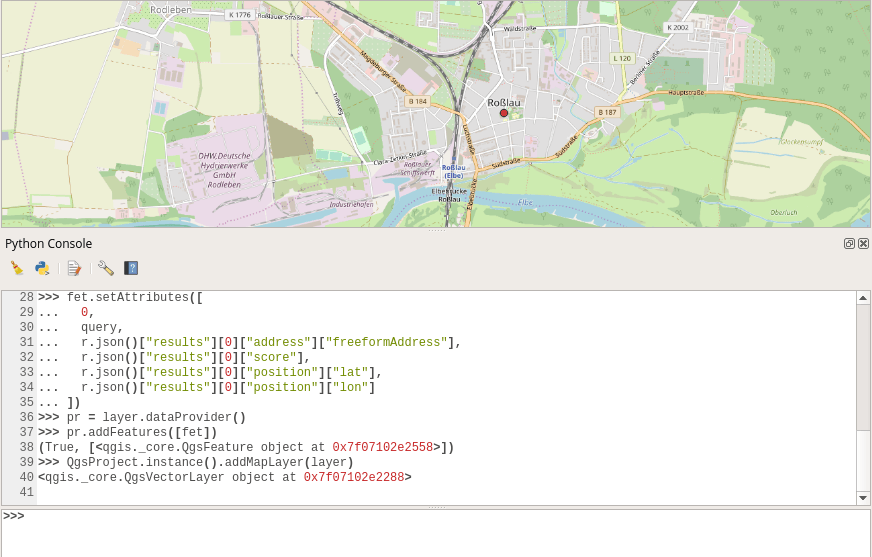
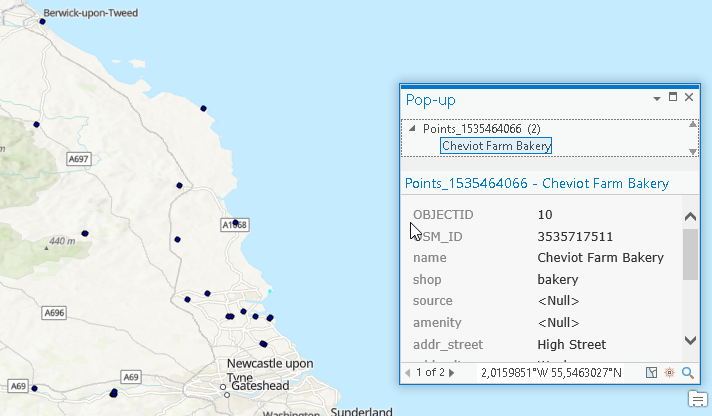
The ArcGIS REST API provides some interesting endpoints which can be used for free with a developer account. But how to do this in QGIS as you might…

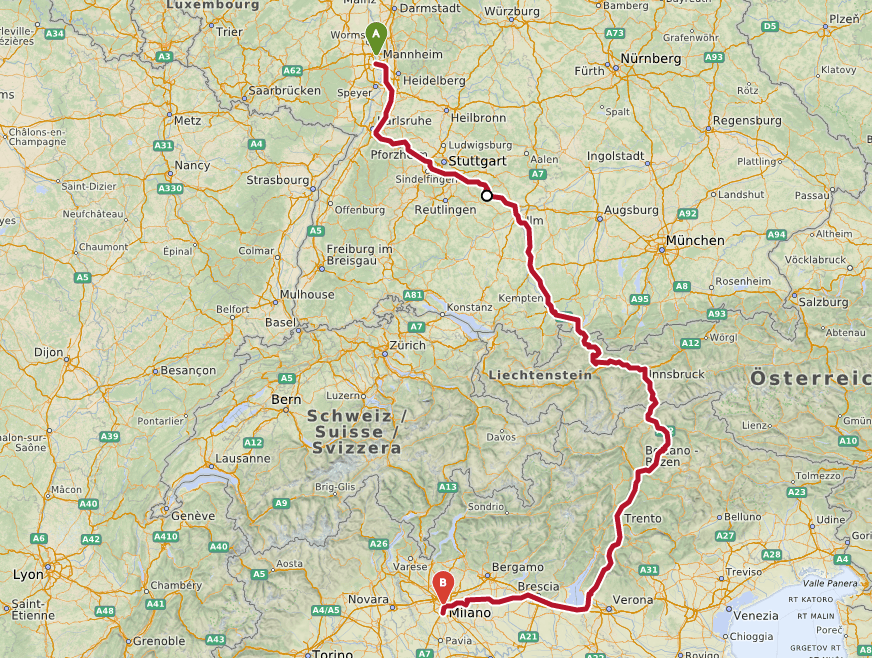
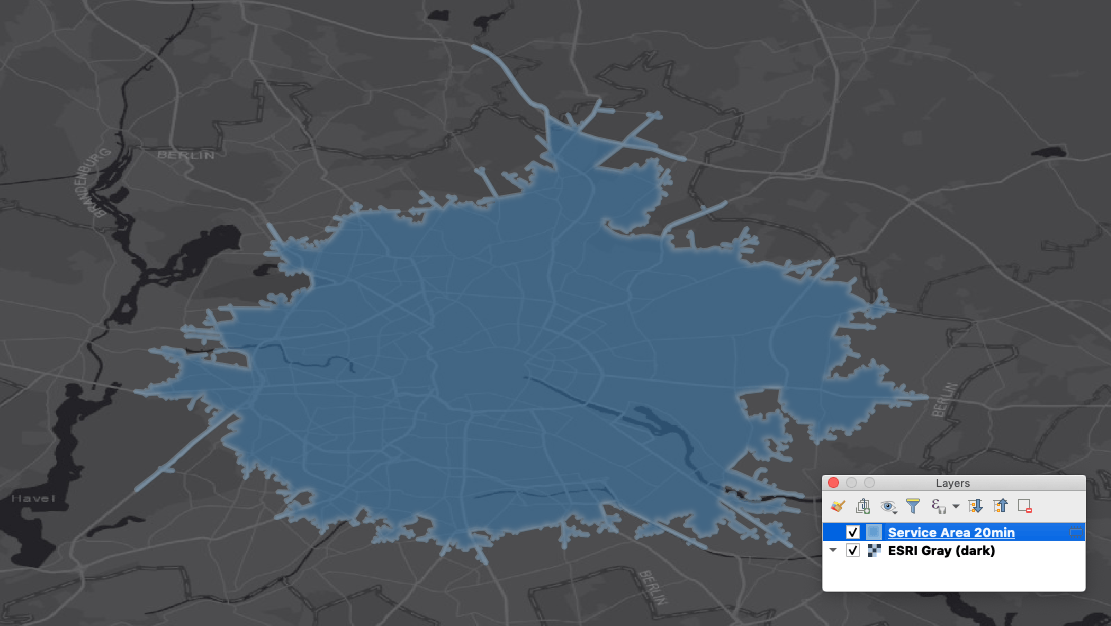
We’re happy to announce the release of v4.5 of openrouteservice, which exposes unique services for two of our core API’s, routing and isochrones. Now you can restrict routes…

On 24th of February, the QGIS developers have officially released QGIS 3 (codename “Girona”). It is the third major version of the free and open source cross-platform GIS…