While preparing for an upcoming presentation at the annual meeting of the American Geophysical Union (AGU) I came across a topic that I thought might make an interesting blog post. The presentation is about using data from the Sentinel-1 mission for Earth Science applications. The Sentinel-1 spacecraft are C-band SAR systems launched and operated by the European Space Agency (ESA). An innovative aspect of this mission is that the collection scenario devised by ESA is systematic and very broad in coverage. Using Sentinel-1 we can monitor Earth using SAR data like never before.
Background
The idea for this example was a MongaBay article about how sugarcane cultivation was resulting in large-scale deforestation in Bolivia. The remote-sensing examples they used were from optical satellites, particularly the Planet doves and UrtheCast. These are great instruments but limited, particularly in the tropics, by cloud cover. This is the perfect application for Sentinel-1 and its day-night, all-weather capability.
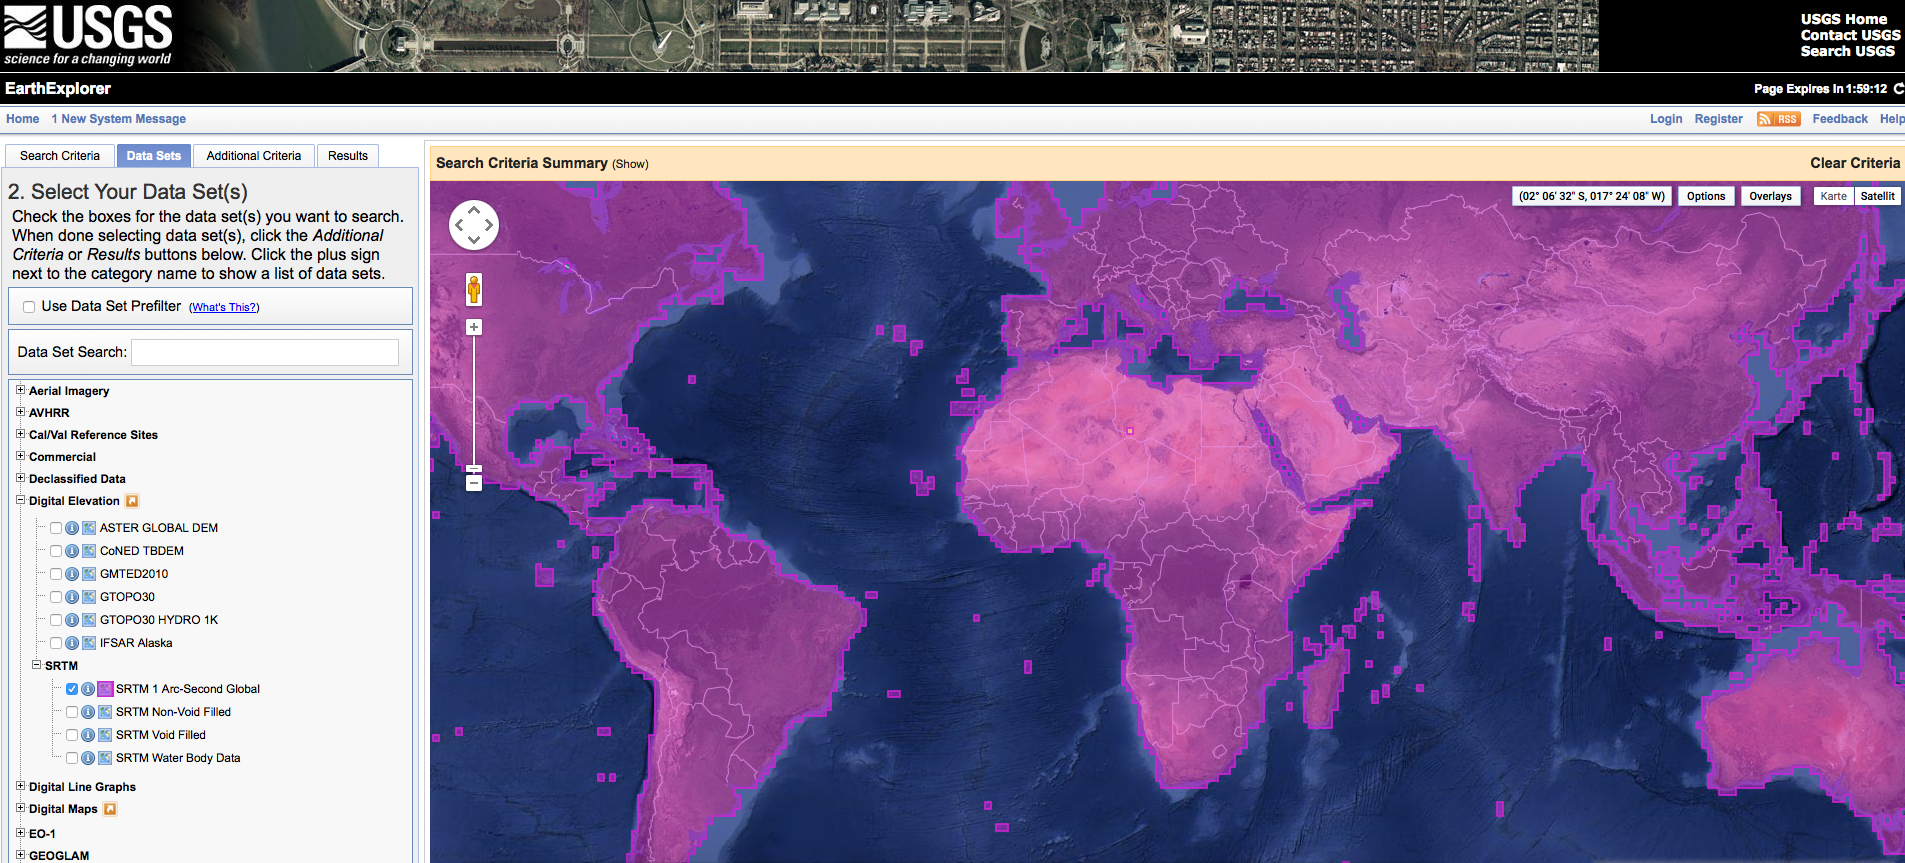
Looking through the Sentinel-1 archive (Sentinel Science Hub or Alaska Satellite Facility) I was quickly able to identify 30 scenes covering almost two years for this area, and data continue to be collected.
Data Processing
The data were processed using the Sentinel-1 Toolbox, a free suite of software tools provided by ESA. S-1 Toolbox is a java-based tool providing a large number of functions for SAR imagery analysis and interferometric SAR (InSAR). One thing I like about it is that the processing functions are also available from the Graph Processing Tool (gpt). The gpt provides for command line access to the functions of the toolbox. This means anything you can do for a single image in the graphical interface can be done in batch mode for multiple images using the gpt. In this case the 30 images were imported, calibrated, orbit corrected, and radiometrically terrain corrected (orthorectified) with no manual intervention. A future digital-geography.com post will be about how to use gpt and your favorite scripting language to automate processing.
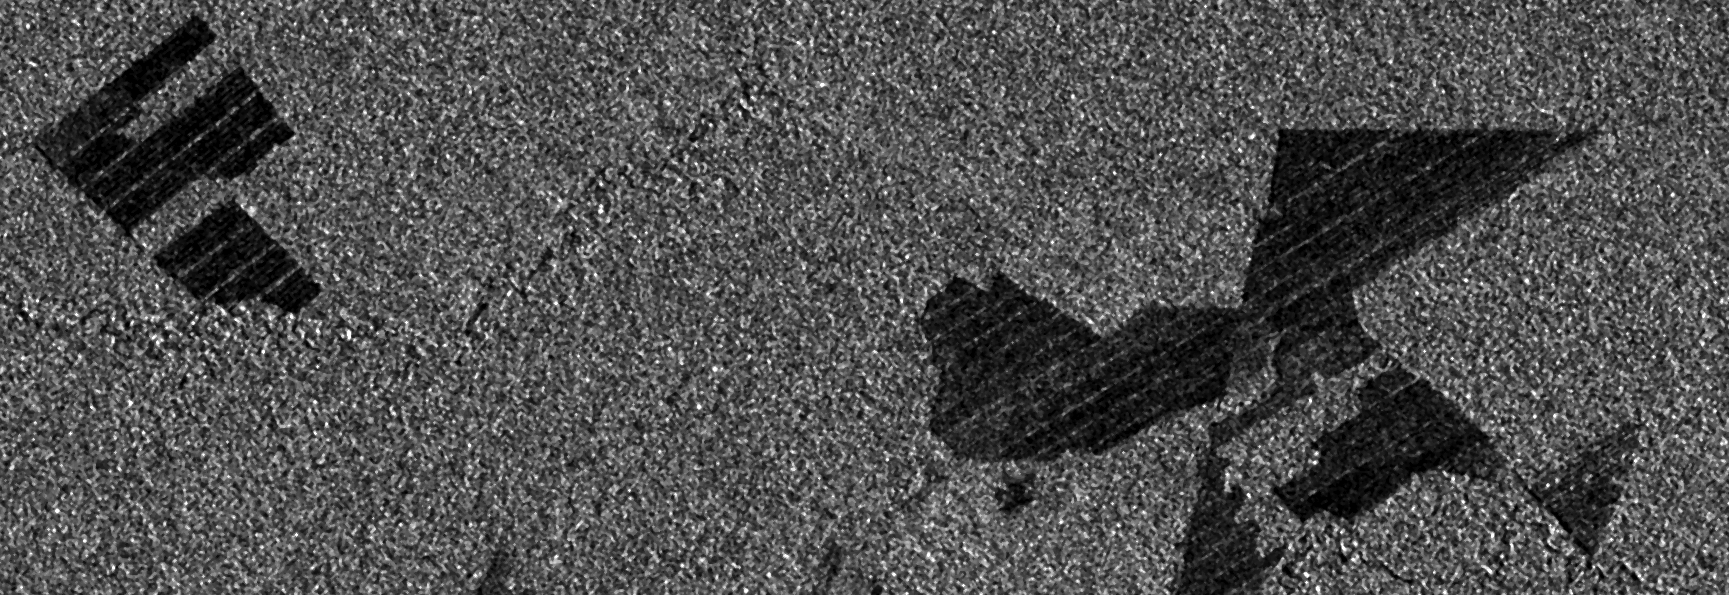
The example image below shows the change in backscatter over the two year period. The dark areas in the lower image are areas of forest that have been cleared for sugarcane cultivation.
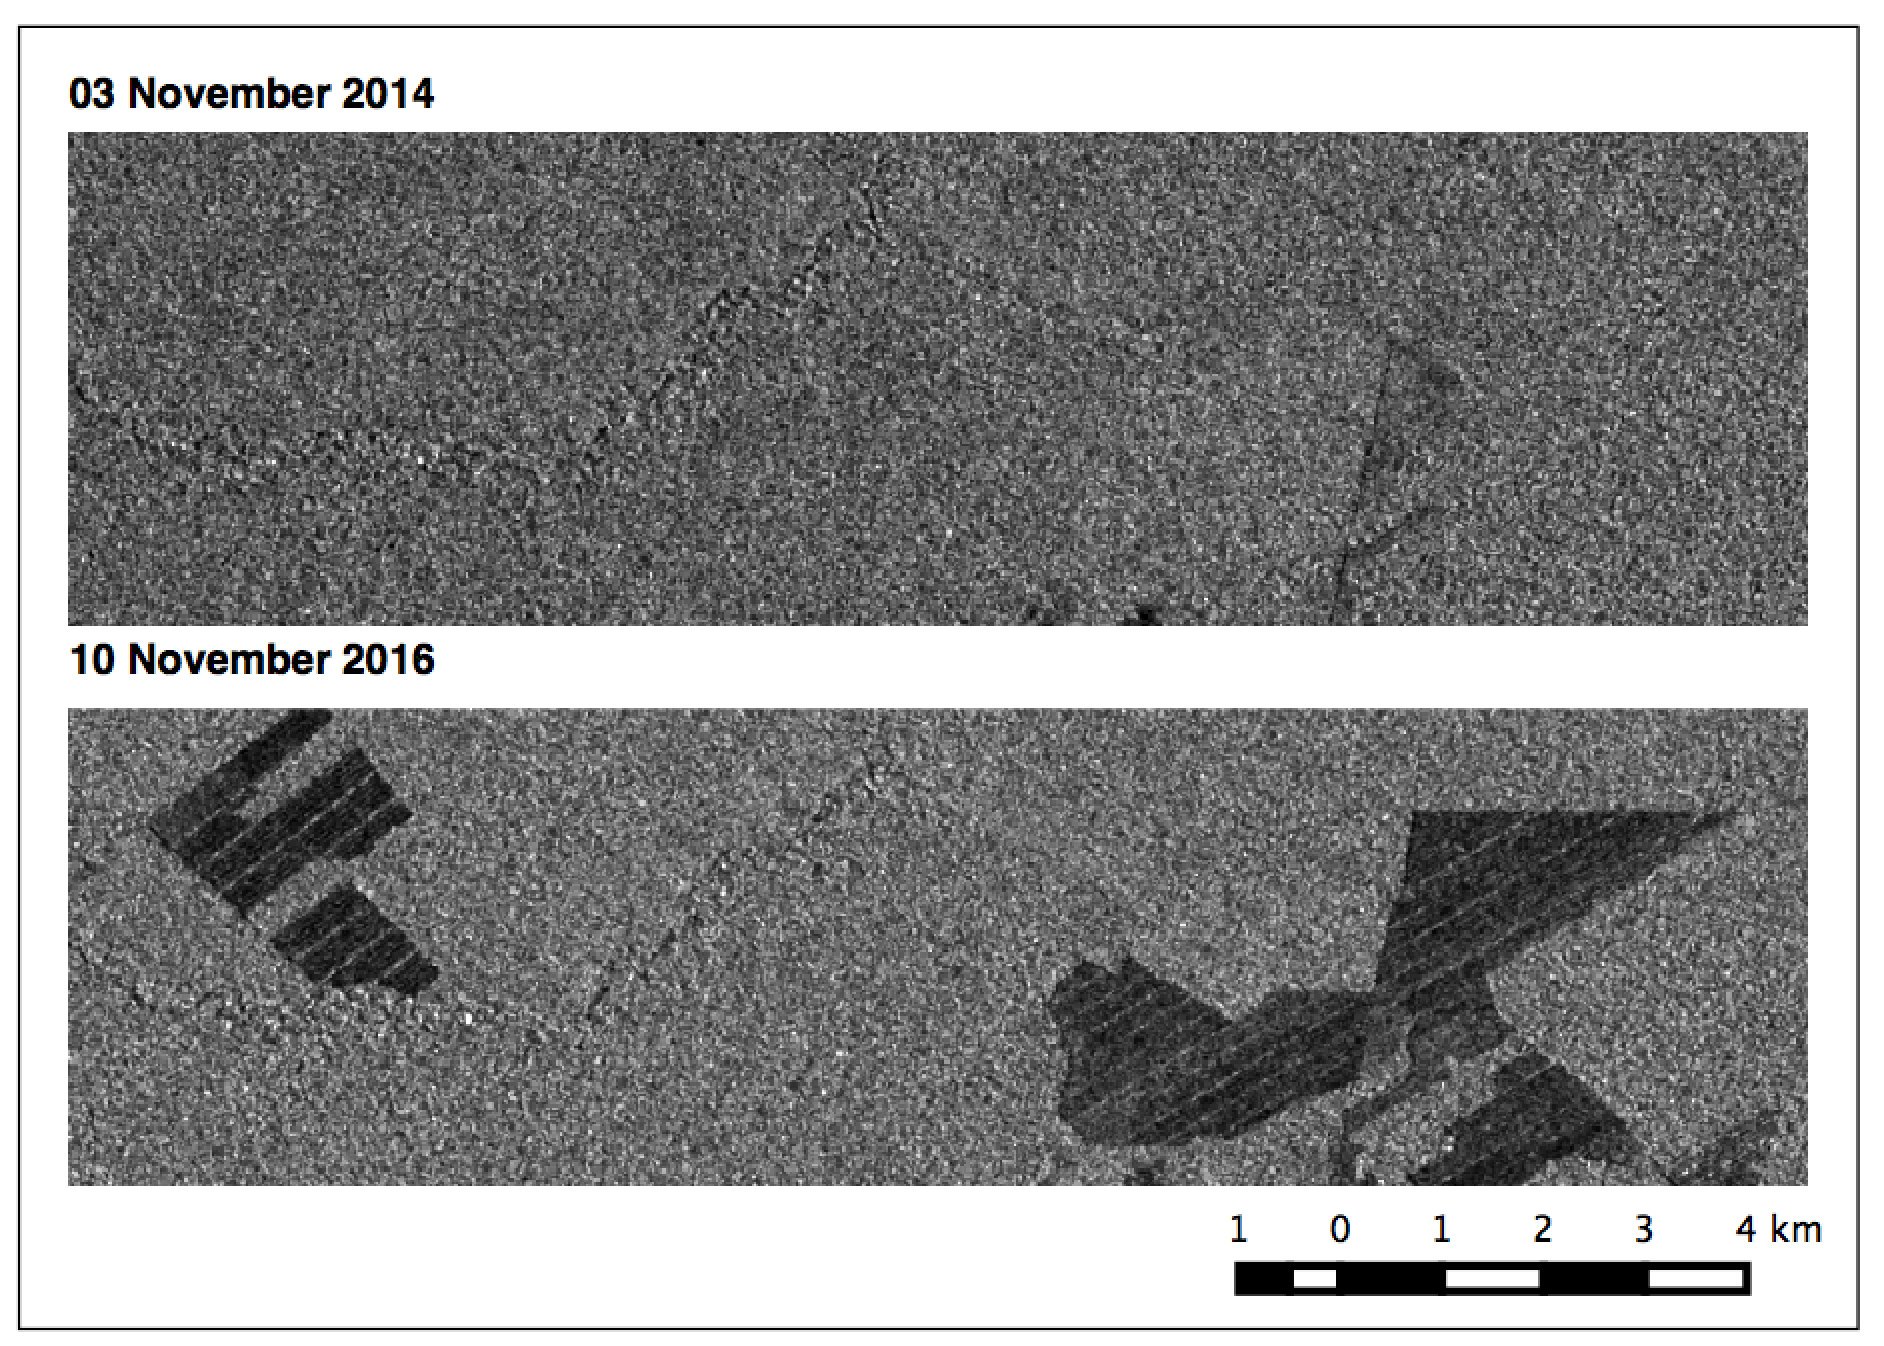
Seeing this image really got me going! Here we have easy-to-detect deforestation that is continuing even as I write this post. Using the basic elements of a change detection algorithm devised by a colleague (Open Access paper here) I looked at the backscatter change in three subsets of this area. The first was an area that had been deforested before the Sentinel-1A launch, the other two were areas that had been recently deforested.
Initial Results
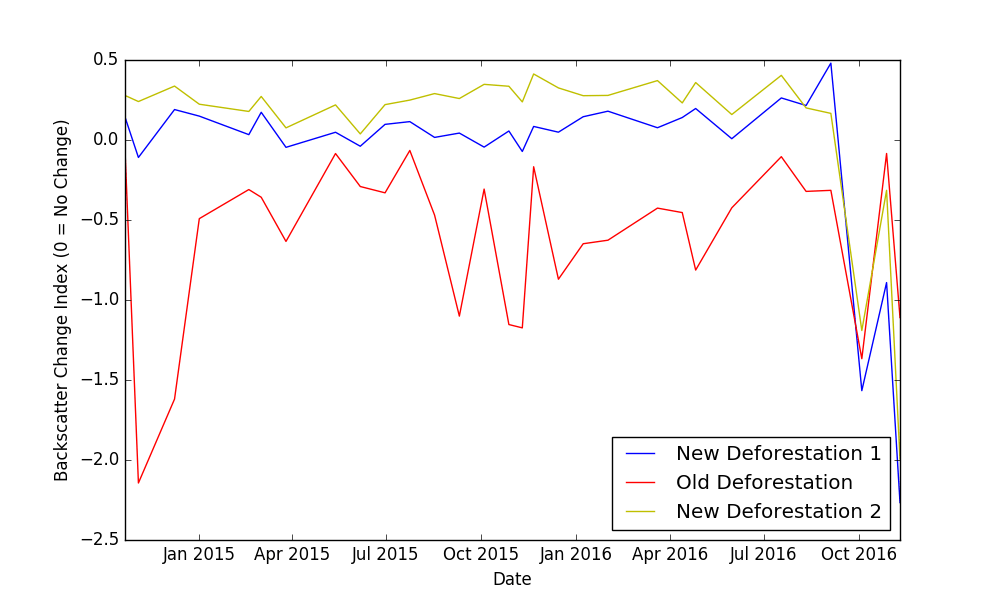
The graph below shows a relatively constant index for the two newly deforested areas until about September 2016, at which time both areas were cleared and their index changes suddenly. The older deforested region always has a change index indicating it is not forest. The declines in change index in Oct/Nov of each year show the seasonal pattern of sugarcane agriculture.
Seeing what a great example this was I also created a short animation and posted it to youtube. Hopefully you will find it as interesting as I did and start thinking about other fantastic applications for Sentinel-1 data.
More information about the Sentinel-1 mission can be found here