As I realized that I have a really huge family I was keen to digitize the current family tree and get into contact to my relatives. For getting things done, I choose the open source genealogy software Gramps to record all offline information about my family members and create a database as base for further investigations, updates and of course spatial visualization. After that, I exported a database view and visualized it with QGIS.
0. Find out more about genealogy


1. Create and fill a genealogy database
First one could ask, why should I use a “professional” genealogy software like Gramps? For me it was the only way how thinks could work. Setting up an EXCEL-sheet wasn’t an option because meta information about relatives could be very extensive and flat-file maintenance based on several data providers is really hard and ugly. If you’re also interested in digitize your family tree and further information, I can recommended the usage of Gramps. So just install it, create a database and fill up the people and family register with all present information. After that you’re ready to visualize your own genealogy data. Further on you can easily create family-trees and several reports out of this database.
2. Export genealogy data
Of course Gramps has a map-module where you can plot all places on a map or ask questions like: “Were some relatives able to meet up with other people from the database, based on their birthplace or current location” and yes, there are a lot of plugins available for Gramps to do some map reports automatically, but nevertheless I chose the export as CSV and imported data into QGIS. Via “Data” > “Export current view “you’re able to export a list of peoples including their birthplace. To get this data view, go to “People” and add the row “birthplace” or some other place category.
3. Geocode places and show data on a map
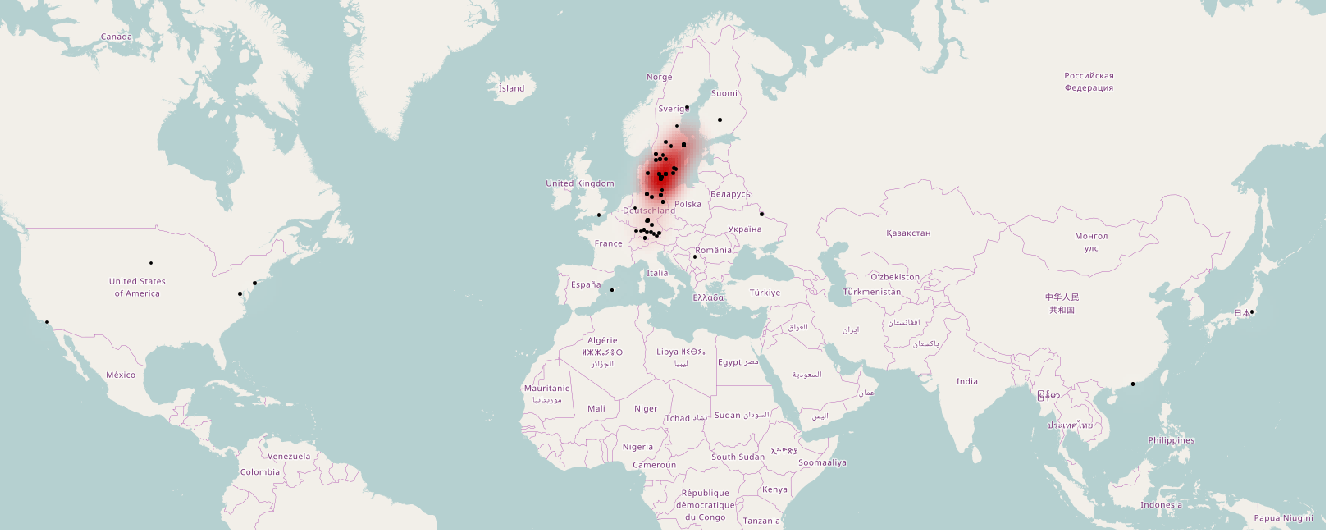
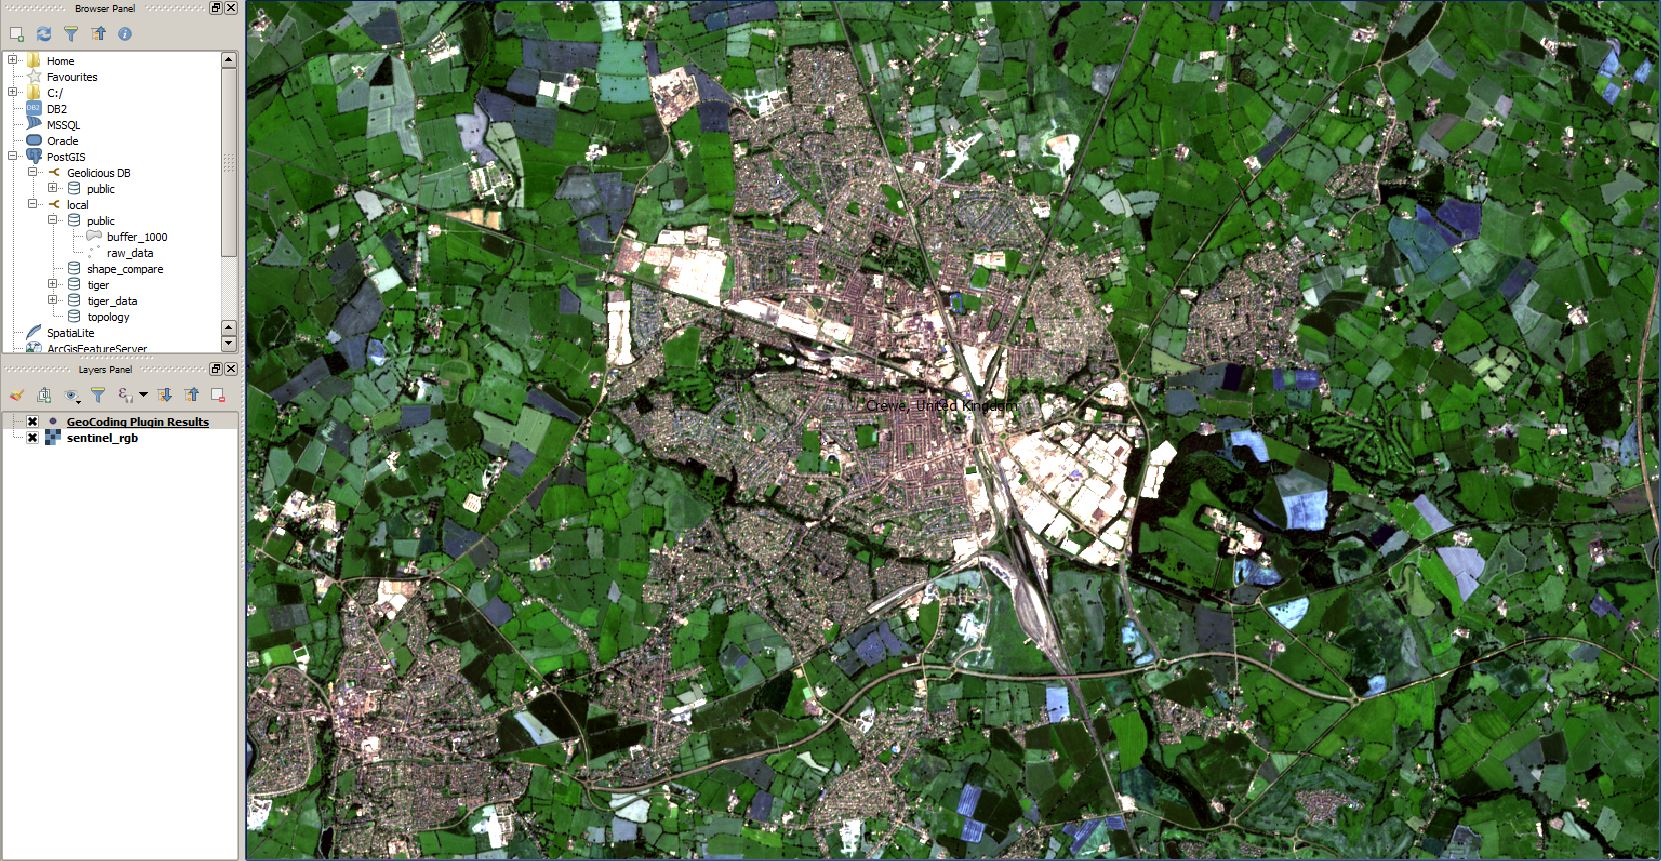
Just copy your places into an online geocoder like this one. Paste the lat, long information into your CSV and use the “Add data by text” button in QGIS to get the data into the QGIS layer tree. After that, export the imported dataset as Shape or GeoJson and feel free to style and process the datapoints – for example: create a heatmap. Of course, this is just a quick and dirty visualization approach. As soon the data is imported in QGIS you’re able to do a lot of neat things, like generating a web-map and sharing it with your family, or animate the local movement from birth to death in a time animation.
Have you ever digitized and visualized your family-tree? What are the best visualizations for genealogy applications?

interesting, thank you!