When Mike Bostock published his (re-) implementation and demonstration of Visvalingams algorithm for line simplification he attracted considerable attention on that. What is a little bit strange in my opinion. This algorithm is old hat as like the second more well-known algorithm invented by Douglas-Peucker. Both can be seen as the basic concepts for the simplification of linear geometric objects when a quick & easy implementable point reduction is essential. And this is what they can achieve…reducing the amount of points, by analysing the topology of each point…not more but also not less! They are well-known and (relativ) easy implementable but obviously it is still not taken for granted to include them to a (web) mapping application.
In this post, I will:
- show you how to visualise your linear data
- show you how to simplify your linear data
- evaluate the algorithms for line simplification that were presented
Let’s begin by…
Obtaining some data
…with high resolution, respectively a LineString that consists of many points.
I’ll steal the idea of Vladimir Agafonkin and obtain a navigation route…in my case from Paris to Moscow…along the way … we can directly learn how to use the API of cloudmades routing service!
A tool that was also new to me before I prepared this post!
All we need are the coordinates of Start- & End- point of the demanded route…
- Paris: Lat: 48.86, Lng: 2.33
- Moscow: Lat: 55.08, Lng: 37.57
…and a APIkey, which are offered for free by cloudmade but you need an account: http://account.cloudmade.com/signin
I have never been to these cities so I just chose any random point within the city using the finale result of the previous d3 mapping basics tutorial to get the corresponding coordinates!
Now…get the *.js file, containing the corresponding LineString (respectively navigation route)…(e.g.: using ‘wget’)
wget http://routes.cloudmade.com/969868da48384c2d8e138511ee807367/api/0.3/48.86,2.33,55.08,37.57/car/shortest.js -O shortest_paris-moscow.js
…or maybe another route ???
wget http://routes.cloudmade.com/969868da48384c2d8e138511ee807367/api/0.3/38.7090,-9.1379,1.2896,103.8529/car/shortest.js -O shortest_lisboa-singapore.js
wget http://routes.cloudmade.com/969868da48384c2d8e138511ee807367/api/0.3/53.54,10.02,48.14,11.51/car/shortest.js -O shortest_hamburg-munich.js
wget http://routes.cloudmade.com/969868da48384c2d8e138511ee807367/api/0.3/52.5663,12.6782,52.33,14.05/car/shortest.js -O shortest_around-berlin.js
Visualise the LineString
First of all…we have to visualise the downloaded file. My strategy is always to build up on an existing, well running implementation. So I’ll use the map from our previous tutorial and reduce it…to have only the background map, one GeoJSON data overlay opened and visualised with D3 in an individual layer.
Use this as initial ‘webmap’ for the following implementations!
OK…let’s replace the ‘roads.js’ with our new LineString (navigation route)… but … before we do that…let’s examine the data, that we’ve got and compare it to the existing data overlay:
    console.log([collection])

    d3.json("shortest_paris-moscow.js", function(navigation_route) {
      console.log(navigation_route);
    })
Looks quit different, right? What did we have in ‘roads2.js’…we had a ‘FeatureCollection’, containing ‘Features’ which contain one geometry. We added all ‘Features’ to the ‘svgContainer’ to visualise the LineStrings.
The only usable object, that we get from the ‘shortest_paris-moscow.js’ file…is the ‘route_geometry’! So…in my opinion…it’s the easiest solution to re-build this ‘Feature’-‘Geometry’ format…
      var allPoints = navigation_route.route_geometry
      var routeGeometry = {'type':'LineString', 'coordinates':allPoints};
      var routeFeature = {'type':'Feature', 'geometry':routeGeometry}
We need them:
- for the Visualisation (as ‘path’):
.data([routeGeometry])
- to calculate the bounds:
var bounds = d3.geo.bounds(routeFeature);
…and we have to:
- reset the map view:
.setView([52.67, 21.97], 4);
- change the function for projection, as x&y have a twisted positions:
var latlng = new L.LatLng(point[0], point[1]);
- remove the ‘bounds’ declaration within the ‘reset()’ function:
//bounds = [[...]]
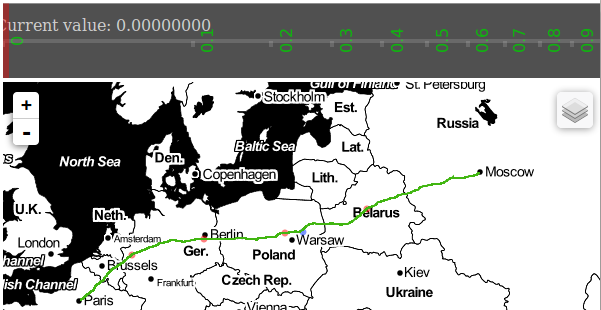
Everything is fine, when your map looks like mine! Btw…let’s visualise the LineString with a prettier color…
stroke:#41b611;
Looks fine is relative, right? The visualisation of the LineString is so detailled and produces so many fractales, that you percieve ‘Jaggies’ (german: ‘Treppeneffekt’) and looks as if it needs something like anti-aliasing to remove that. That’s not cool…
Let’s make it simple
I asked Google for the existing Simplification algorithms…actually there are three interesting libraries:
- pure Douglas-Peucker algorithm
- combination of Douglas-Peucker and Radial Distance algorithms
- pure Visvalingam algorithm
We begin by testing the pure Douglas-Peucker algorithm … import it to your web map…
<script src="http://bl.ocks.org/adammiller/raw/826148/douglasPeucker.js"></script>
…and simplify ‘allPoints’ before you build the ‘routeGeometry’ from them…
console.log(allPoints.length)
allPoints = simplifyPath(allPoints,1)
console.log(allPoints.length)
…this is with a maximum value of 1! Try it and change the maximum value…no difference, right?
This is because ‘simplifyPath’ expects a point-object {‘x’:0, ‘y’:0} and not a point-array [x,y]! So, we have to store ‘allPoints’ as an object…
var allPointObjects = allPoints.map(function(point){return {'x':point[1], 'y':point[0]}})
…but as the ‘path’ object needs ‘point-arrays’ we have to re-write them afterwards again. That is why I directly write a function for that…
  function pointsConversion(points, direction){
    var cache;
    if(direction=='toObject'){
      cache = points.map(function(point){return {'y':point[0],'x':point[1]}});
    }
    else if(direction=='toArray'){
      cache = points.map(function(point){return [point.y,point.x]});
    }
   return cache;
  }
…with this function, we can convert the arrays to objects…
var allPointObjects = pointsConversion(allPoints, 'toObject')
…simplify line, by applying Douglas-Peucker …
(source)
allPointObjects = simplifyPath(allPointObjects,0.1)
…and re-convert the objects back to arrays…
allPoints = pointsConversion(allPointObjects, 'toArray')
What do we commit to the function ‘simplifyPath()’:
- an array of points: [[x0,y0], [x1,y1],…,[xn,yn]]
- the tolerance (max. value) of simplification: Float (same unit as datainput)
This is our navigation route simplified by a pure Douglas-Peucker algorithm, with:
- tolerance = ‘0.1°’
- (approx.) processing time ~ 0.11 seconds
- number of points = 23 (original 16614)
Simplify line, by a combination of Douglas-Peucker and Radial Distance algorithms
(source)
Changing our existing code to use the simplification library of Vladimir Agafonkin is pretty simple!
Import the library…
<script src="http://mourner.github.io/simplify-js/simplify.js"></script>
…and just change the corresponging command for simplification…
allPointObjects = simplify(allPointObjects,0.1,false)
What do we commit to the function ‘simplify()’:
- an array of points: [[x0,y0], [x1,y1],…,[xn,yn]]
- the tolerance (max. value) of simplification: Float (same unit as datainput)
- highest quality simplification: Boolean (exclude the distance-based preprocessing step)
This is our navigation route simplified by a combination of Douglas-Peucker and Radial Distance algorithms, with:
- tolerance = ‘0.1°’
- (approx.) processing time (highest quality=false) ~ 0.003 seconds
- [(approx.) processing time (highest quality=true) ~ 0.007 seconds]
- number of points = 23 (original 16614)
Simplify line, by Visvalingam algorithm
(source)
Using this library is just a little bit more work but not really complicated!
We begin by adding the library. The basic code implementation written by Mike Bostock works only on ‘MultiPolygons’…I haven’t found an improved version for other geometries, like ‘LineString’ as we need. That is why I provide you a modified version, which also simplifies pure ‘LineStrings’…
<script src="http://bl.ocks.org/milkbread/raw/5909613/simplify_RK_1.1.js"></script>
OK…Mike wrote the function as an ‘object’…so we have to initialize the function as ‘object’…
var d3Simplify = d3.simplify();
…which needs a projection, although it would use ‘Mercator’ as default …
d3Simplify.projection(function (point){return point});
…actually, this is no projection! The effect is, that we keep point values ‘unprojected’, because we project them already onto the map!
Go on…and simplify the coordinates…
d3Simplify( {'type':'LineString', 'coordinates':allPoints})
…this is different, right?
The previous libraries need a ‘point-object’ containing x-& y-values. This library needs a ‘geometric-object’, that has to consist of (at least) geometry-‘type’ & ‘coordinates’. This is even a little bit better, as we can use our point-array as it is and just commit it to the ‘coordinates’.
Another fact is different, did you notice? It does not return anything! The point-array is commited ‘by Reference’ while each point gets extended with a third value. This third value represents the size of the calculated triangle (see how it works). That is why we have to filter the point-array after we’ve applied the simplification algorithm on them…
allPoints = allPoints.filter(function(point,i){return point[2]>0.1})
…that’s it…almost! The 2 previous libraries needed a conversion to ‘point-object’ and therefore a re-conversion to ‘point-array’ afterwards. This is not necessary for this version, so comment this…
//allPoints = pointsConversion(allPointObjects, 'toArray')
And finally…test this algorithm with a very high value (e.g.: 100)! I throws an error, right? This is because it removed all points and now the visualisation part has nothing to visualise. The quickest correction to avoid this failure is to almost keep the start-& end- point static! Change the filtering of points…
var numPoints = allPoints.length;
allPoints = allPoints.filter(function(point,i){if (point[2]>0.1 || i==0 || i==numPoints-1) return point})
Notice! Alocating the length of the array to a variable is necessary, because the length of the array will not be static!
Now we’ve got it!
What do we commit to the object ‘simplify()’:
- a geometric object: {‘type’:’LineString’,’coordinates’:point-array}
- the tolerance (max. value) of simplification: Float (same unit as datainput)
This is our navigation route simplified by a combination of Douglas-Peucker and Radial Distance algorithms, with:
- tolerance = ‘0.1°’
- (approx.) processing time ~ 0.10 seconds
- number of points = 31 (original 16614)
Evaluate the presented algorithms
I made a nice little application, that will help you to make a quick and dirty evaluation of the 3 introduced algorithms, respectively libraries!
When we only consider the processing time, it is obvious which library offers the best performance:
Vladimir Agafonkins library is much faster than the other libraries.
Let’s proof this by making 100 iterations (only between the tolerance values 0 – 0.1) in the app above and analyze the average processing time:
| Douglas-Peucker pure |
Douglas-Peucker combined (max. quality: false) |
Visvalingam | |
|---|---|---|---|
| Once (tolerance: 0.1) |
0.110 s | 0.003 s | 0.100 s |
| Average time of 100 iterations (tolerance 0-0.1) |
0.149 s | 0.008 s | 0.100 s |
I think this ‘approved’ performance of the ‘combined Douglas-Peucker’ doesn’t leave any question, which library to choose.
But what about the quality of the simplified LineString? After all, it is still a navigation route, which we do not use to navigate…but it should still (at least in the smaller zoomlevels, resp. high scales) give us an indication of the main places that we are going to see when we plan to drive the route.
That means the route should stay topologic consistent, meaning it should still lead along the most necessary points. Therefore, I added 4 (red) points to the map, at which we can check the consistency of the LineString:
- var essenPoint = L.circle([51.47, 6.97], 200).addTo(map);
- var berlinPoint = L.circle([52.31, 13.30], 200).addTo(map);
- var plonskPoint = L.circle([52.62, 20.38], 200).addTo(map); (near of warsaw)
- var minskPoint = L.circle([53.90, 27.56], 200).addTo(map);
Describing the complete evaluation would be too complex … but … you can do it on your own using the application above!
In conclusion, all three of the presented algorithms offer an adequate quality – for our purpose – wherefore I emphasize my first impression and recommend you to use Vladimir Agafonkins JS-library applying the Douglas-Peucker algorithm combined with radial distance analysis. It is fast and produces good results for this purpose!
As I said, this is especially true for this special example of a navigation route. Maybe we should try it with a LineString that represents a scandinavian shoreline with lots of fjord!? How about Polygons…can we simplify them by keeping topology? Or how could we implement scale dependent simplification? That’s all very good stuff for my next posts…
Finally, many thanks to the authors of the applied libraries for sharing their code with us!
- http://mourner.github.io/simplify-js/
- http://bost.ocks.org/mike/simplify/
- http://bl.ocks.org/mbostock/5732029
- https://gist.github.com/adammiller/826148
(Technical testing conditions: AMD Phenom II, 3,9GB RAM, Ubuntu 12.04 (64-Bit), Chromium)

Hey, I forgot to tell you something about the built-in simplification of Leaflet!
Here’s a simple example: http://bl.ocks.org/milkbread/5933662