In modern scientific researches of biological direction the geographic information systems (GIS) are increasingly used. For example, GIS technology is successfully applied in the study of patterns of spatial and temporal distribution of biological objects with taking into account the unique features of the environment. Typically, a GIS is used for the analysis of current events and / or the future forecast, but they are also useful for the study of the fossils, living conditions in the distant past, changes in biodiversity and for determining historical patterns of biosphere evolution.
Convenience of GIS for integrated paleontological studies is due to the combination of database management systems functionality, editors of raster and vector graphics and a variety of analytical tools.
Over the last decades of paleontological researches a huge number of fossils belonging to a variety of species of animals, plants and microorganisms has been found. For a comprehensive qualitative analysis of this information it is not enough to draw on the paper map a certain amount of points. Maximum efficiency of the analysis can be achieved by creating a database and its integration with GIS. But if not so long ago each individual researcher or a research institute tried to do their own, as a rule, small databases containing information gathered only by them, but now there is a fundamentally new approach to automate many operations and combine the efforts of many scientists and research teams from all over the world. The projects that implement in practice, such approaches already exist. Paleobiology Database (Paleontological database) can be considered as one of them, 350 specialists from 133 institutions in 24 countries took part in this work. Currently this database contains information on more than a million found fossils, and it is open and available for use under the license of Creative Commons.
The project directly on the site offers the ability to retrieve information on several parameters and to visualize it on a map. Since using this interface it is impossible to specify a number of additional parameters for a selection, and besides, many researchers want not only to look at something shown on a map, but they want to be able to operate with this data, put them on their own maps and analyze it using their own tools, then Paleobiology Database offers a convenient API (application Programming Interface).
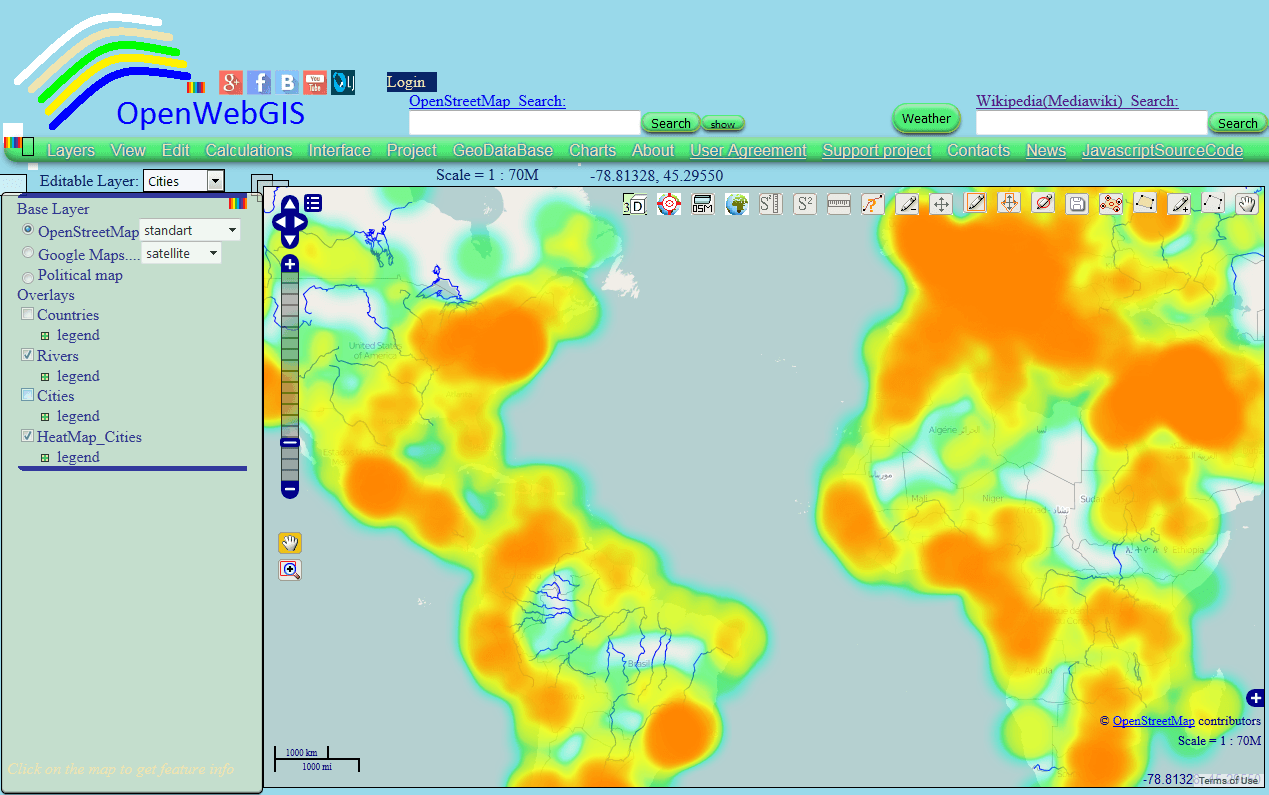
But it is obvious that not every paleontologist wants to waste their time on understanding of how to program the selection from the database and how to apply the selected information on a map. An open GIS project of OpenWebGIS offers paleontologists significant help. Using this online GIS a selection from paleobiological database can be easily and quickly implemented and in one click the results will be applied on the map. As such maps the following ones can be chosen Google Maps, OpenStreetMap or your own vector map, if it is pre-loaded on the server of OpenWebGIS. Then the researcher can customize the data display legend, perform mathematical analysis using a vast variety of tools offered in the menu item “Calculations” and get a visual image to be saved on a disk or to be printed, and as well to export the result to KML, GML, JSON, GPX formats for work in other GIS systems.
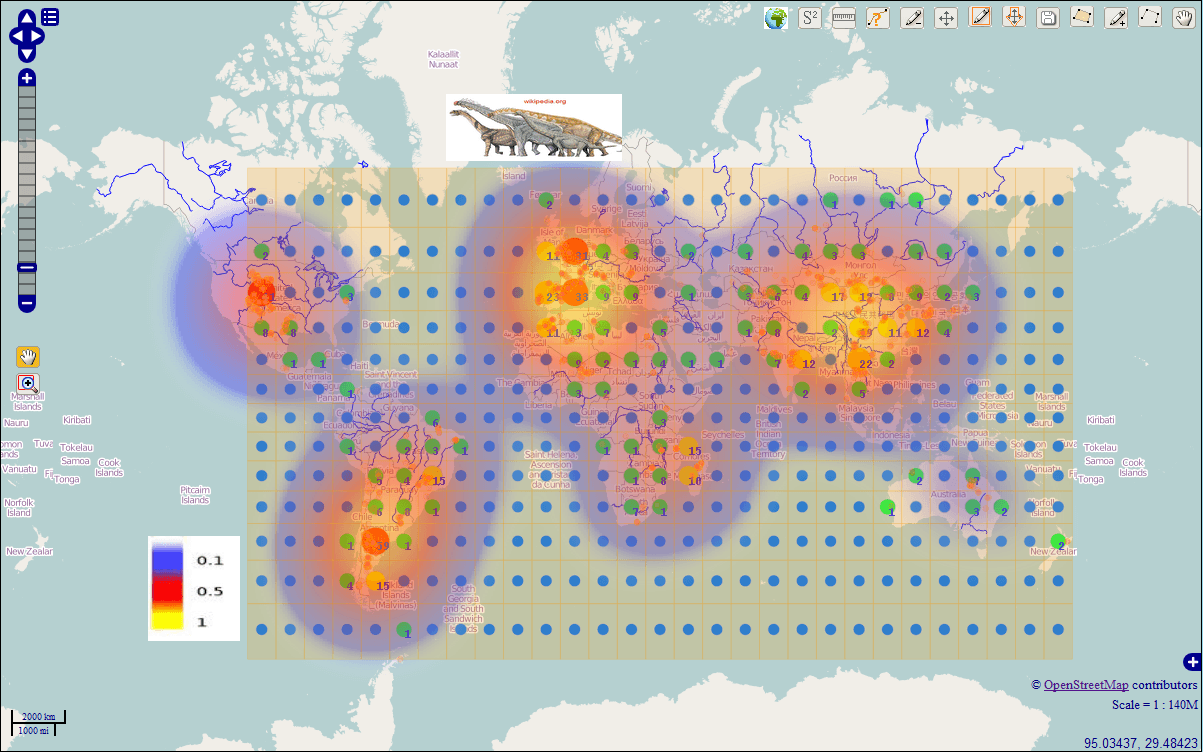
As an example of the analysis of information from the fossil database using OpenWebGIS it is possible to use a map showing the genetic diversity of the infraorder sauropod (Sauropoda) in the form of the spatial distribution of the number of births to 10-degree squares.
This map is created by applying to it the selection with the “taxon” parameter equal to Sauropoda, without any restrictions of time periods, with subsequent aggregation of the number of genera encountered in each square to its center (the menu item ‘Calculation of the squares’), and the build of the heat maps (interpolation) (menu item ‘interpolation’) in these values.
The result of these calculations is shown in the picture below.
Besides that, it is possible to determine in what period of time there was the most genera variety of Sauropoda. To do it for the layer of SauropodsInput let’s calculate the genera quantity for each time interval. It is necessary to use the following formula countByTime=count(EARLY_INTE,GENUS_NAME) in the text area Calculation on the page of attribute table. Let’s build the chart on the results of this calculation. The chart is shown in the picture bellow.
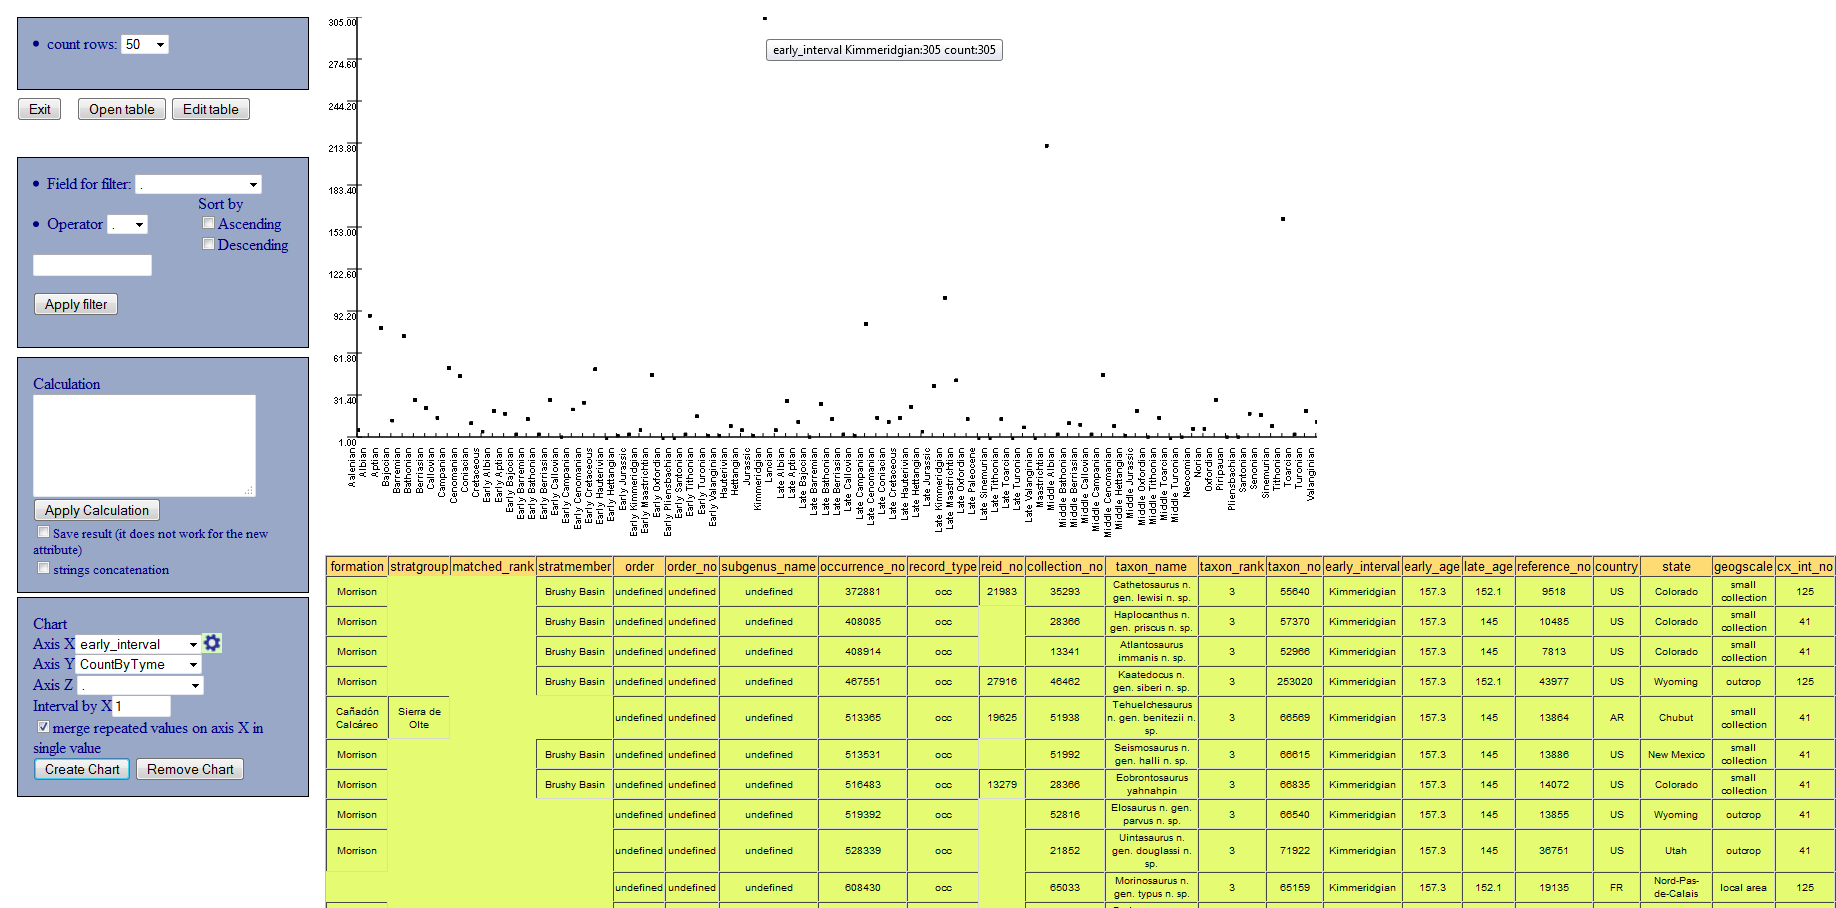
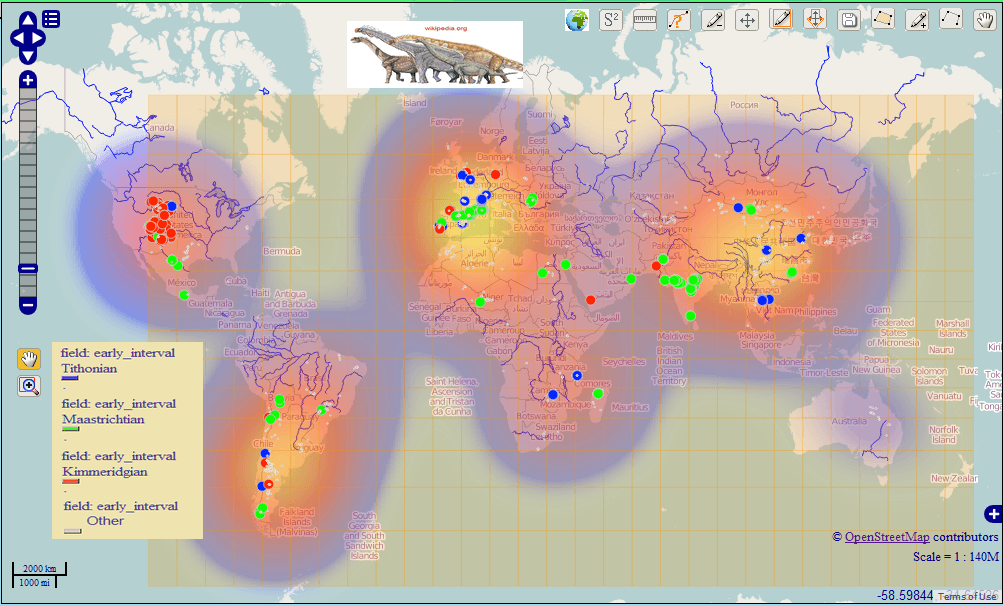
It is seen from the chart that the most genera quantity of Sauropoda was in Kimmeridgian, Maastrichtian and Tithonian. Let`s change the legend of SauropodsInput layer by means of coloring the points in which the fossils corresponded to defined above time periods respectively red, green and blue, all the other points will be colored grey. The result is shown in the picture below.
You can make your selections and apply them automatically on the map using the menu item of OpenWebGIS ‘GeoDataBase-> Paleobiology database’.
Such cooperative online usage of paleobiological databases and GIS gives to a paleontologist a handy tool for quick modern and non resource consuming (there is no need to install any additional software on your computer) analysis of a large amount of information.

Excellent!
Interesting. I would like to see the continents in the positions they were in during the 3 periods, which would show the latitudinal distribution of sauropods.
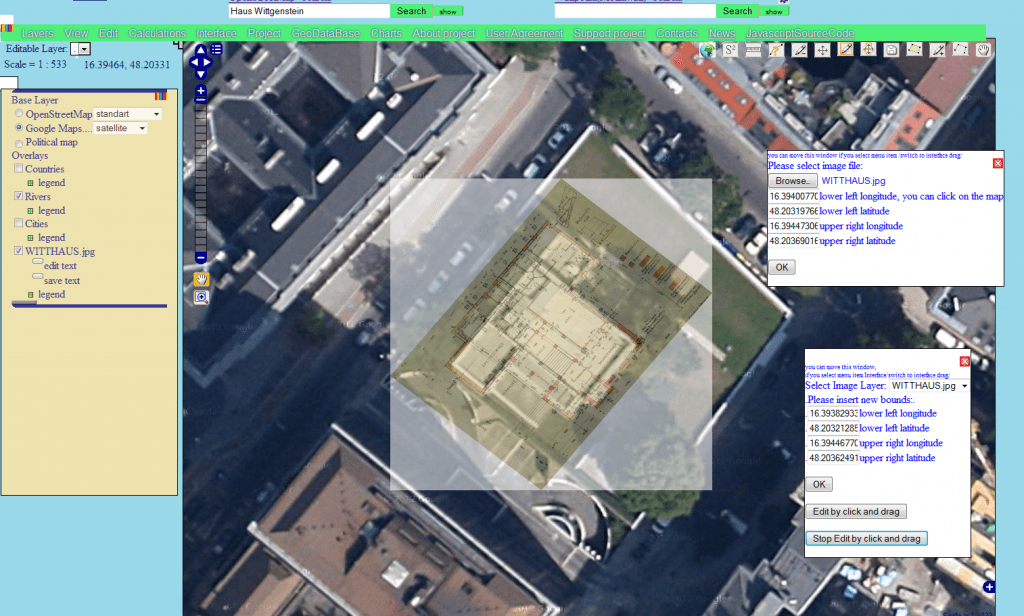
It’s easy! You can upload in OpenWebGIS your own shape, gml, etc. file with continents and view it
http://www.youtube.com/watch?v=3bJqteBkcos
Please, see on the image