So, we all know how a topographical map looks like. On a topographic map, we see different objects, which are indicated by different symbols. For example, we see the elevation marks, vegetation, settlements and so on.
But how to make topographic map itself? It is in this article, you will learn how to make a simple topographic map.
All we need is a digital elevation model and ArcGIS (I use ArcGIS 9.3.1).
Our map will display terrain and elevation marks (contours).
As a digital elevation model I will ASTER GDEM v.2. But there are other digital terrain models, such as SRTM. You can use a digital elevation model SRTM or ASTER. With the choice of the model you decide for yourself which is best for you.
So, we have a digital elevation model portion of the Penza region, Russia. (Figure 1).
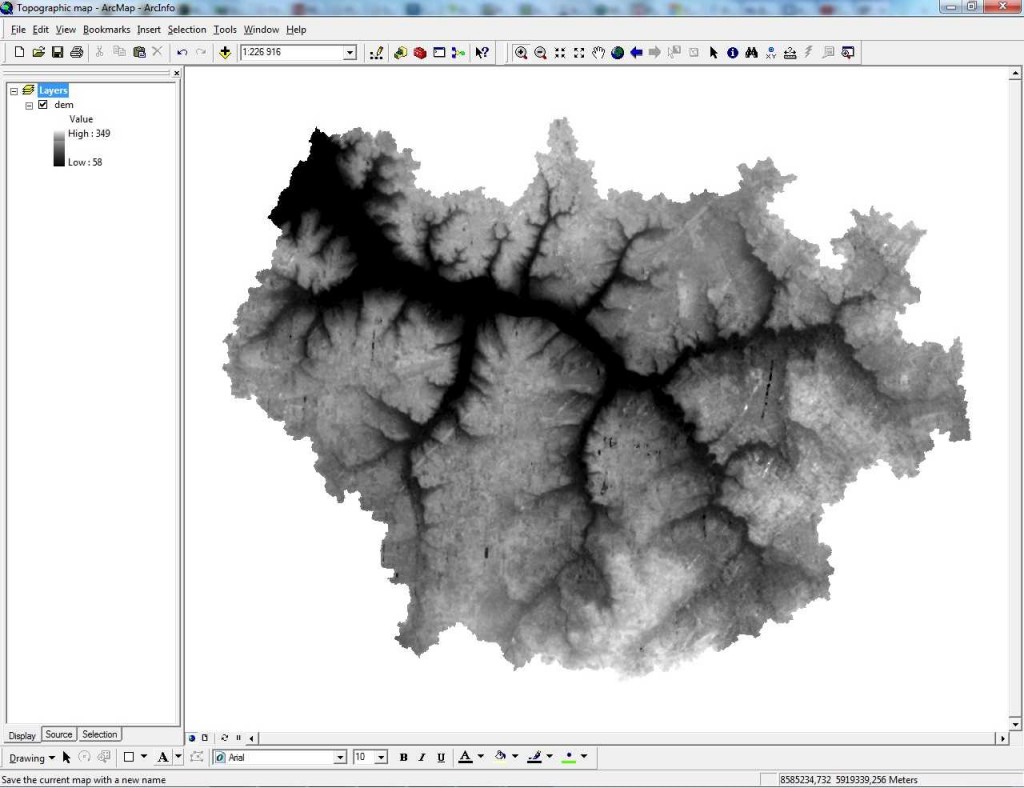
Figure 1
We see the black-and-white image of the relief, the dark colors correspond to lower areas, bright colors correspond to higher elevations. This DEM will be our first layer. Next, we need to calculate hillshade. To calculate hillshade, you must select the View menu >> Toolbars >> Spatial Analyst tool (Figure 2).
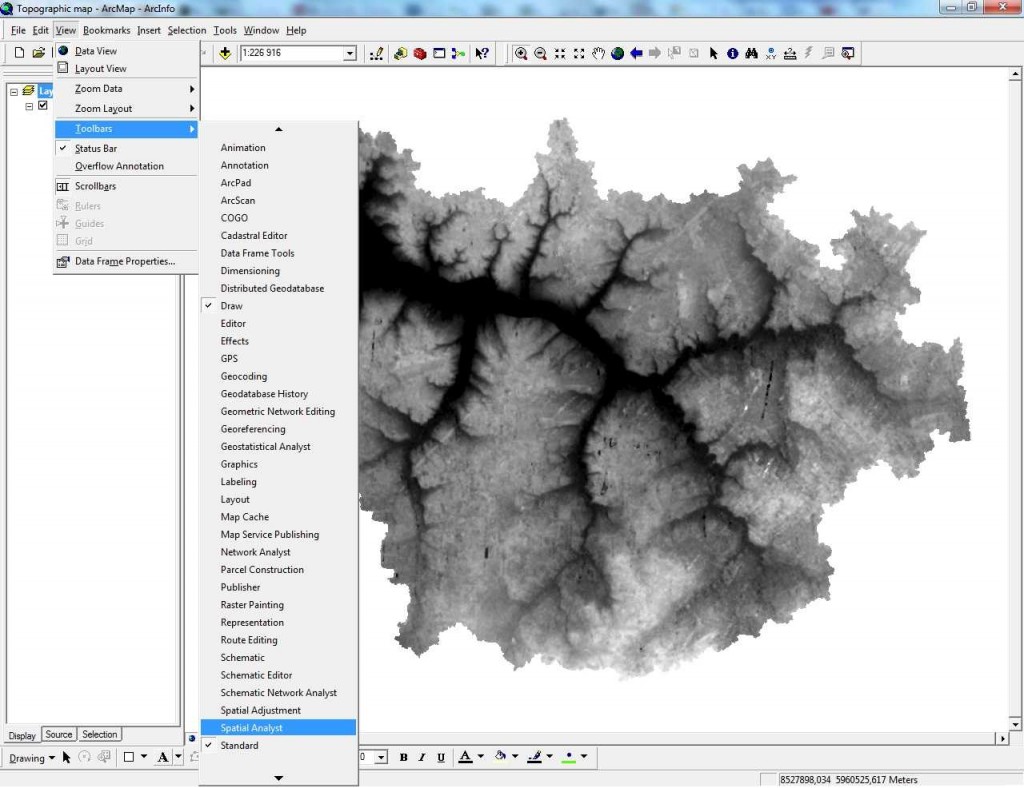
Figure 2
In the Spatial Analyst tool select “Surface analysis” and click on “Hillshade”. (Figure 3).

Figure 3
So, we see “Hillshade” window (Figure 4). We see some different values for angles of artificial light. You can change these values to those that you want but sticking with the default values is good to go!
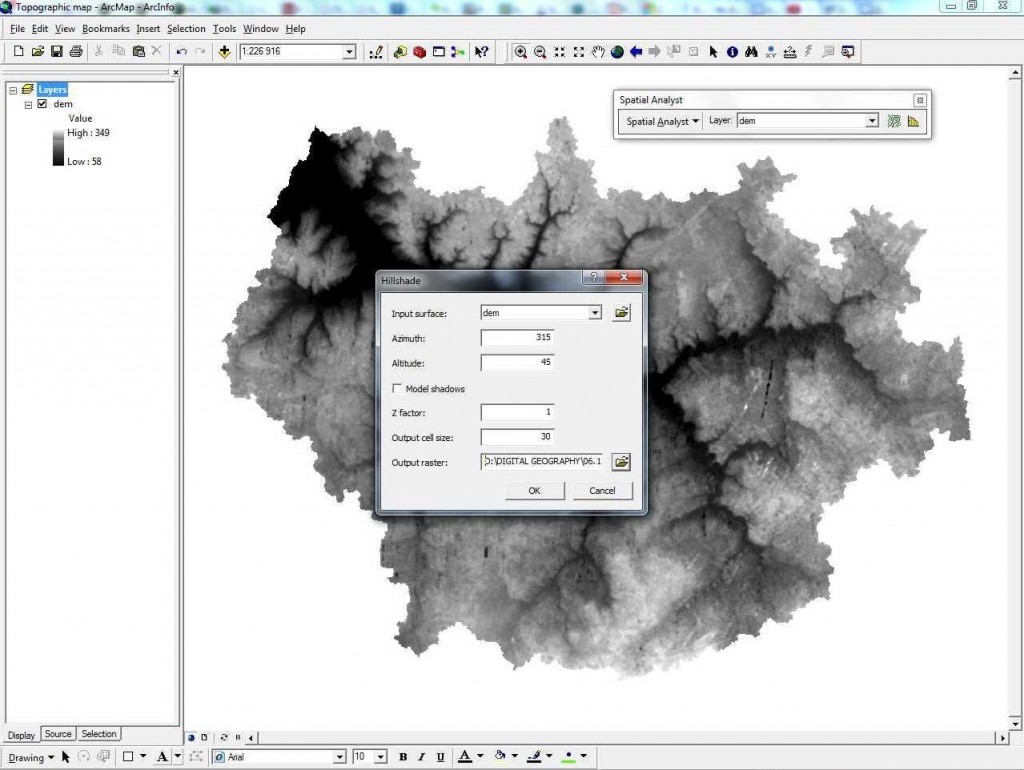
Figure 4
Now we have a hillshade layer (Figure 5), but it looks like ther is no contrast.
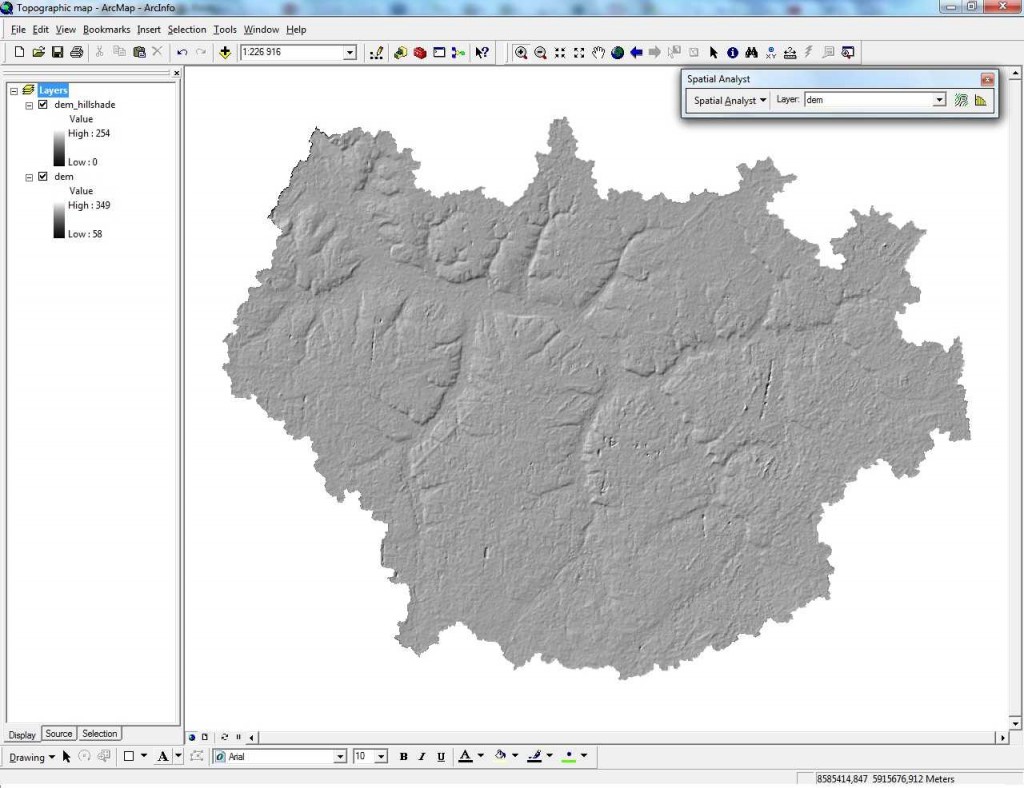
Figure 5
Right click on the layer “Hillshade” and select “Properties”. Choose the Stretch type “Standard deviations” (see Figure 6). Click “Ok”.
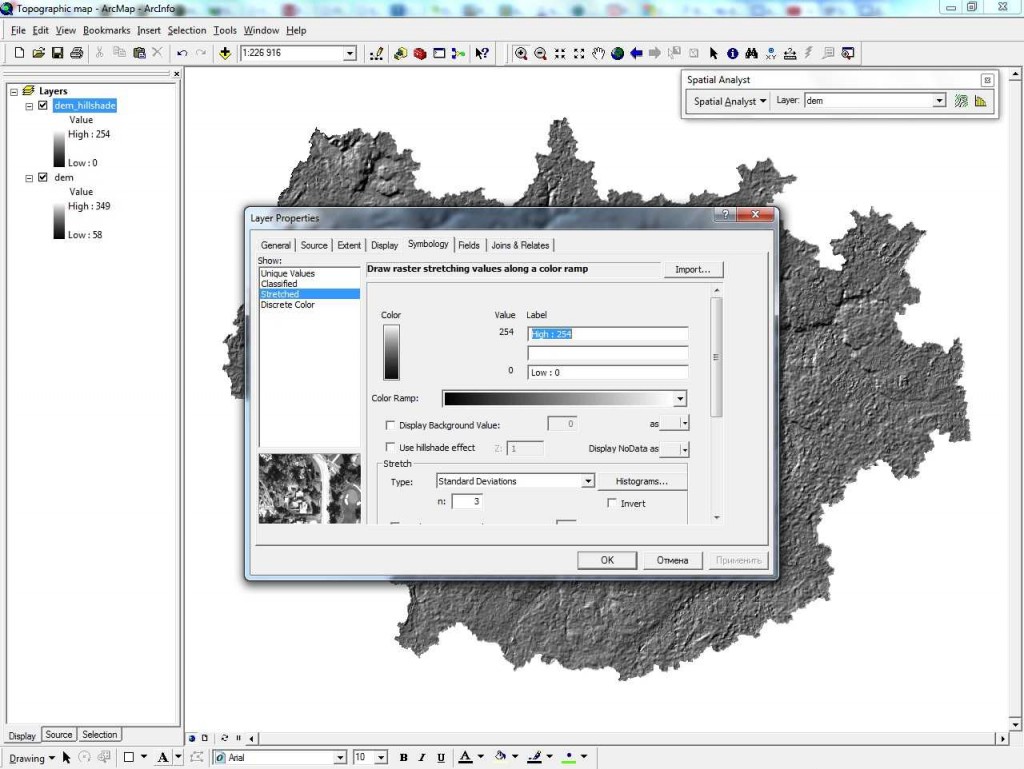
Figure 6
So the image looks better now.
This image will be our second layer. Now we need to change layers in places. DEM layer should be at the top. Turn to the classification of the relief. Right click on the layer “DEM” and select “Properties”. Go to the “Symbology” tab. Right click on the “Color ramp” and uncheck the “Graphic View”. Choose “Surface” in list. Click “OK”. Now we have to specify the number of classes. In this case, I set 15 classes. Click “Classify” button. Set the natural breaks values what you want but once again, default is fine. Click “Ok” (see Figure 7, Figure 8, Figure 9).
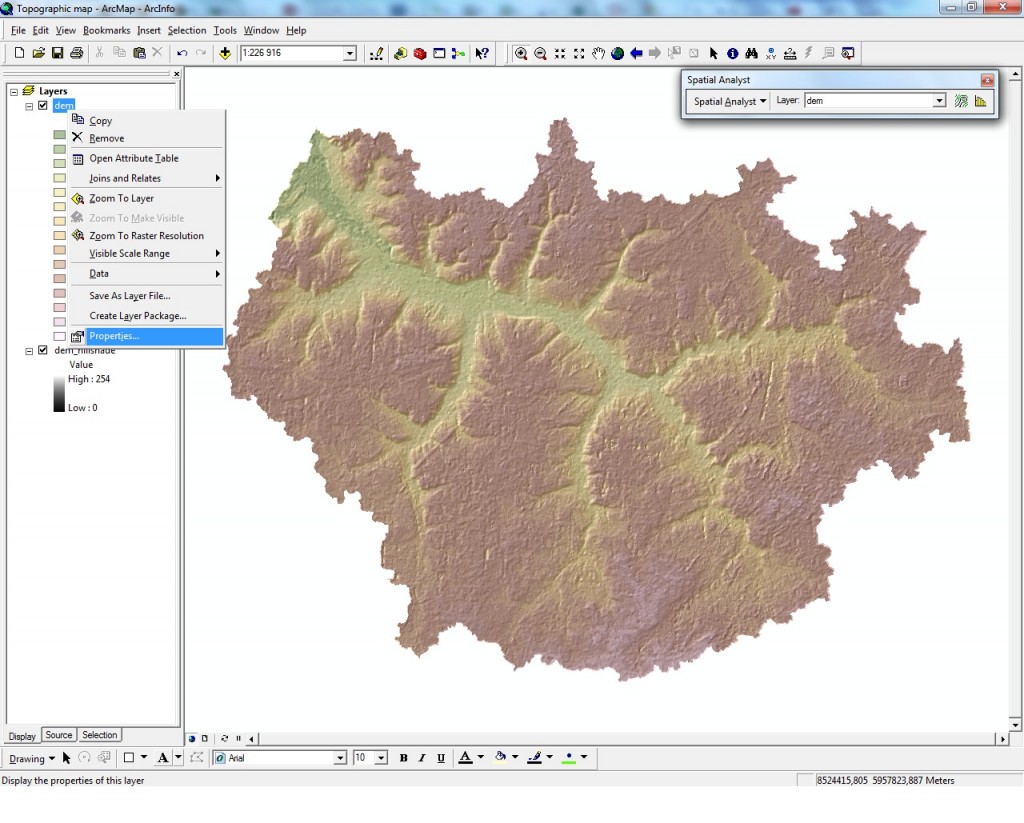 Figure 7
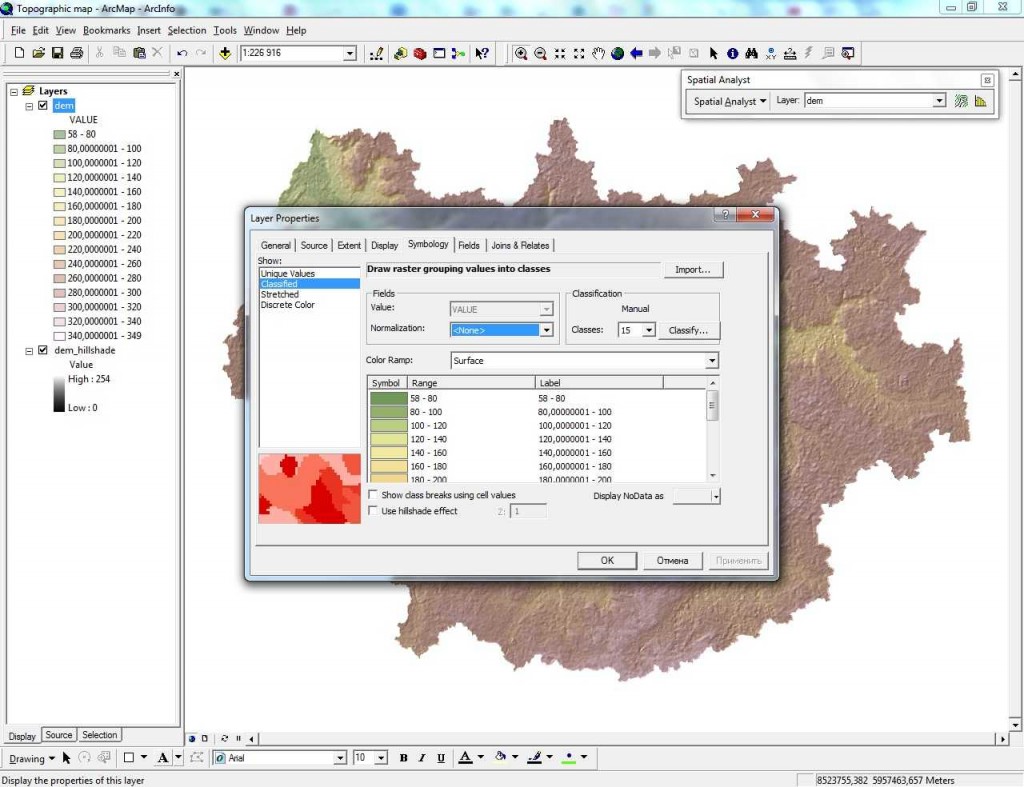
Figure 8
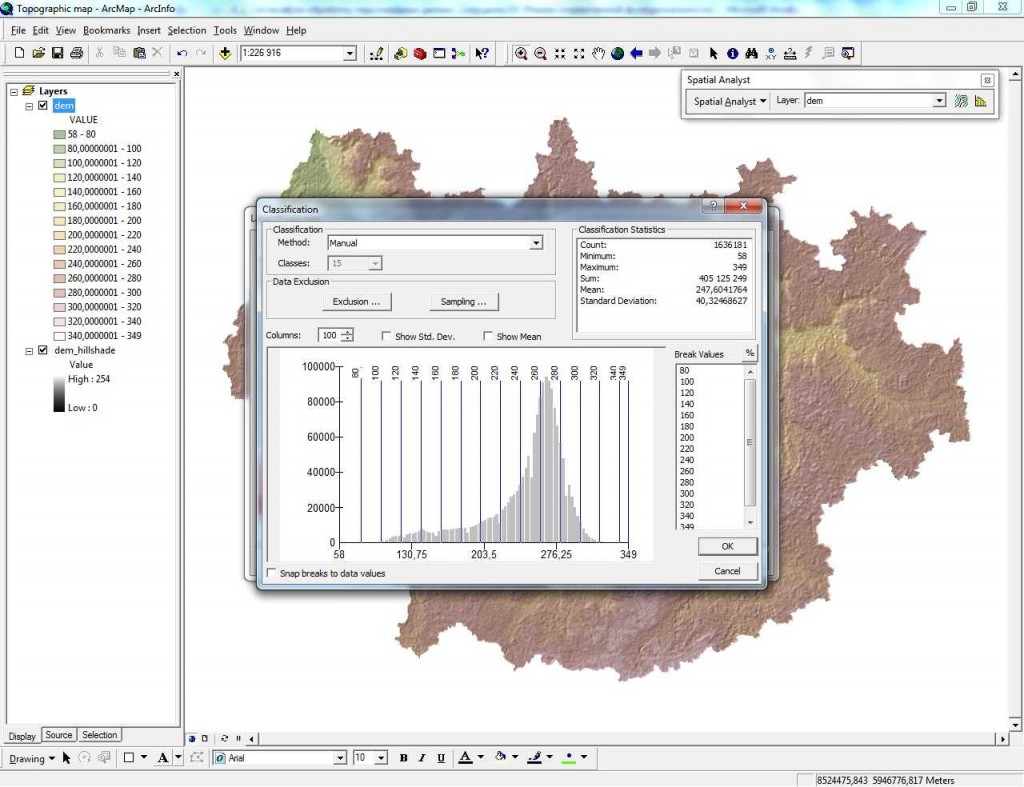
Figure 9
Go to the tab “Display” and set the Transparency value 35 and click “Ok” (Figure 10).
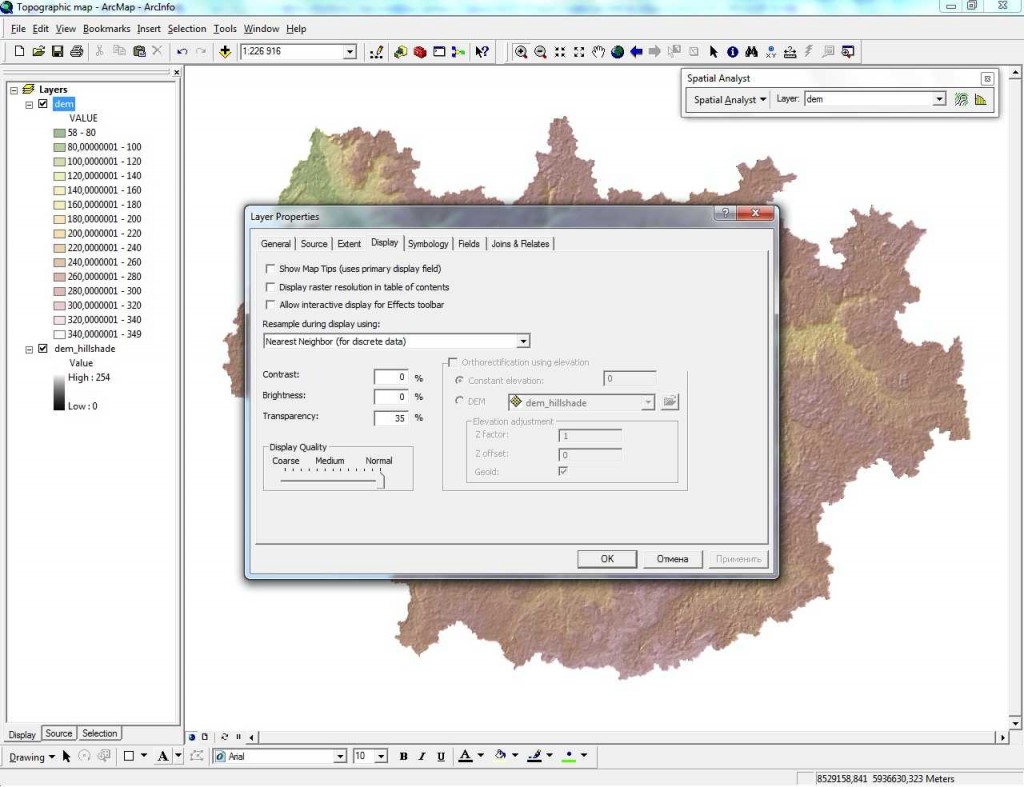
Figure 10
Now we have a nice image of the surface (Figure 11).

Figure 11
Now we need to make the contours (lines with the same height value). To make contours we need once more the Spatial Analyst tool. In Spatial Analyst choose “Surface analysis” >> “Contour” (Figure 12, Figure 13). Set the values what you want as it depends on your height accurancy of the DEM and your relief (high relief -> larger intervalls, low relief -> finer intervalls).
 Figure 12
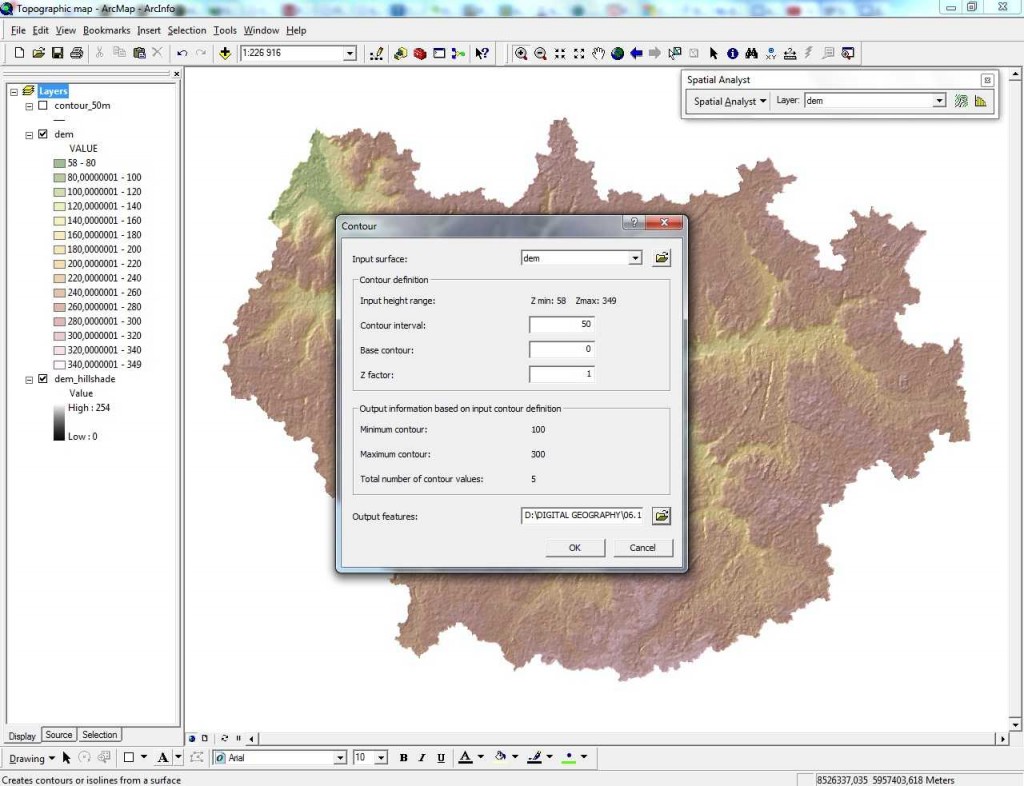 Figure 13
Now we have a contour layer (Figure 14), but we need to mark our contours.
 Figure 14
Right click on the layer “contour” and select “Properties”. Go to “Symbology” tab, choose “Categories” (Figure 15). Choose the value field “CONTOUR”, click “Add Values” button and add heights (Figure 16).
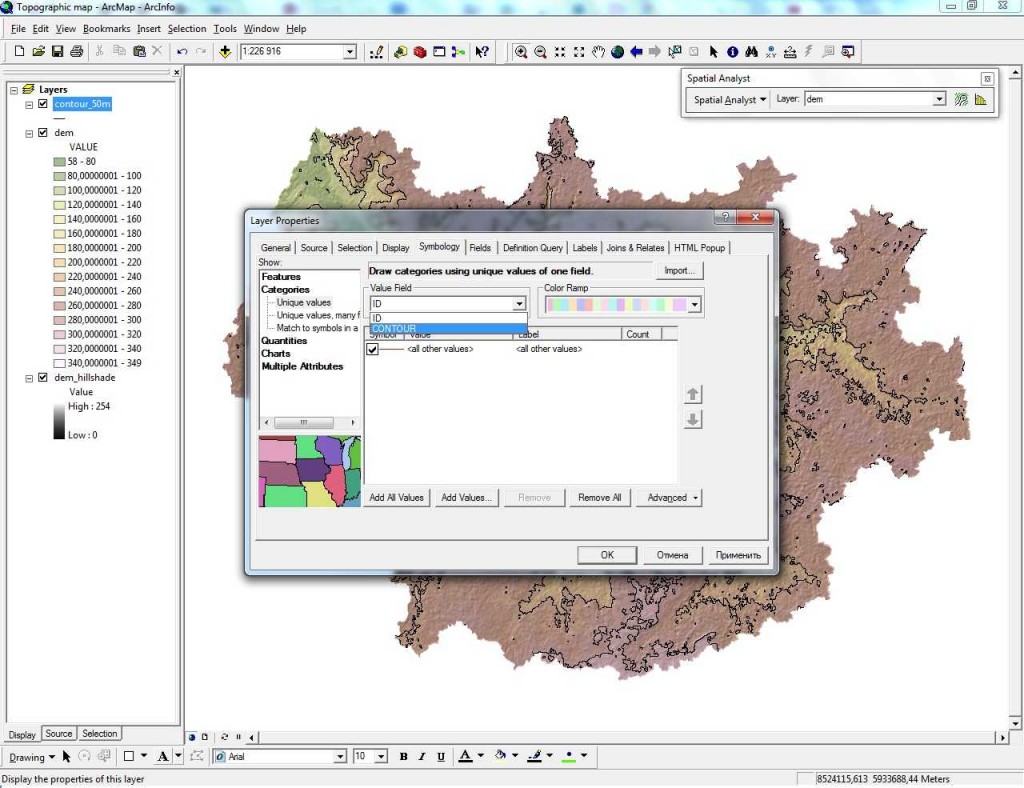
Figure 15

Figure 16
Now we have to group the selected values. Right click on the our added values and choose Group values (Figure 17)
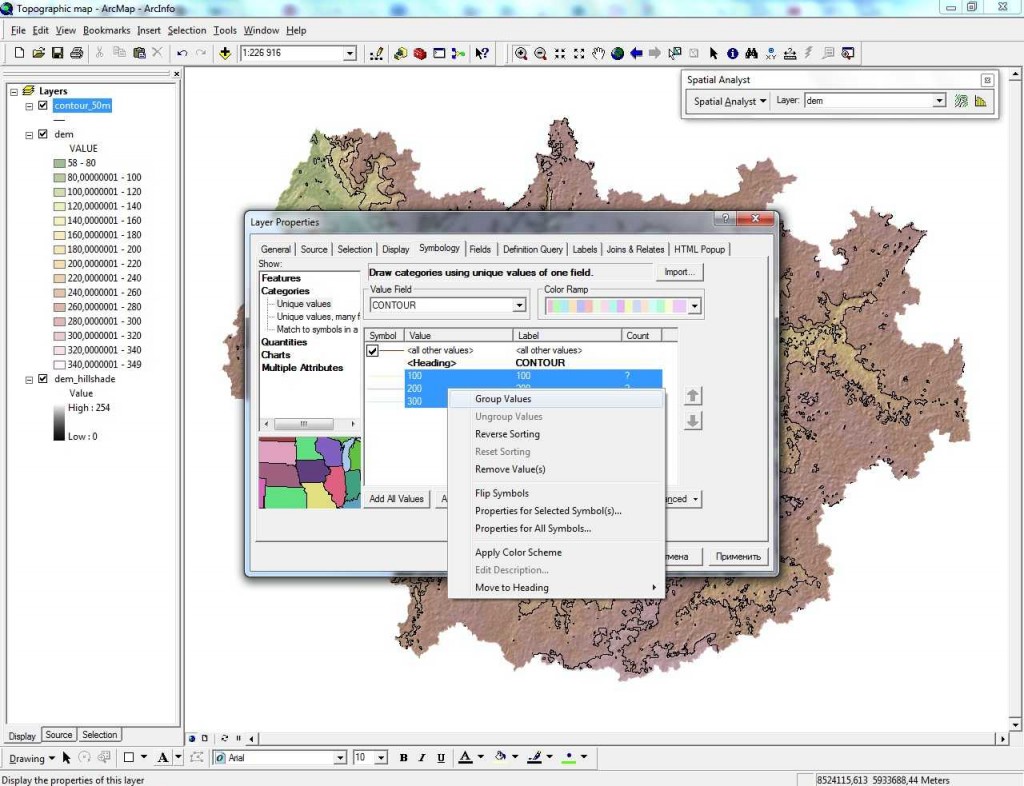
Figure 17
Let’s mark our contours. Double click on “Symbol” for our group of values and choose the “Contour, Topographic, Index” (Figure 18). Change color to black. Double click on “Symbol” for the other values and choose the “Contour, Topographic, Intermediate” (Figure 19). Change color to black. Click “Ok”.
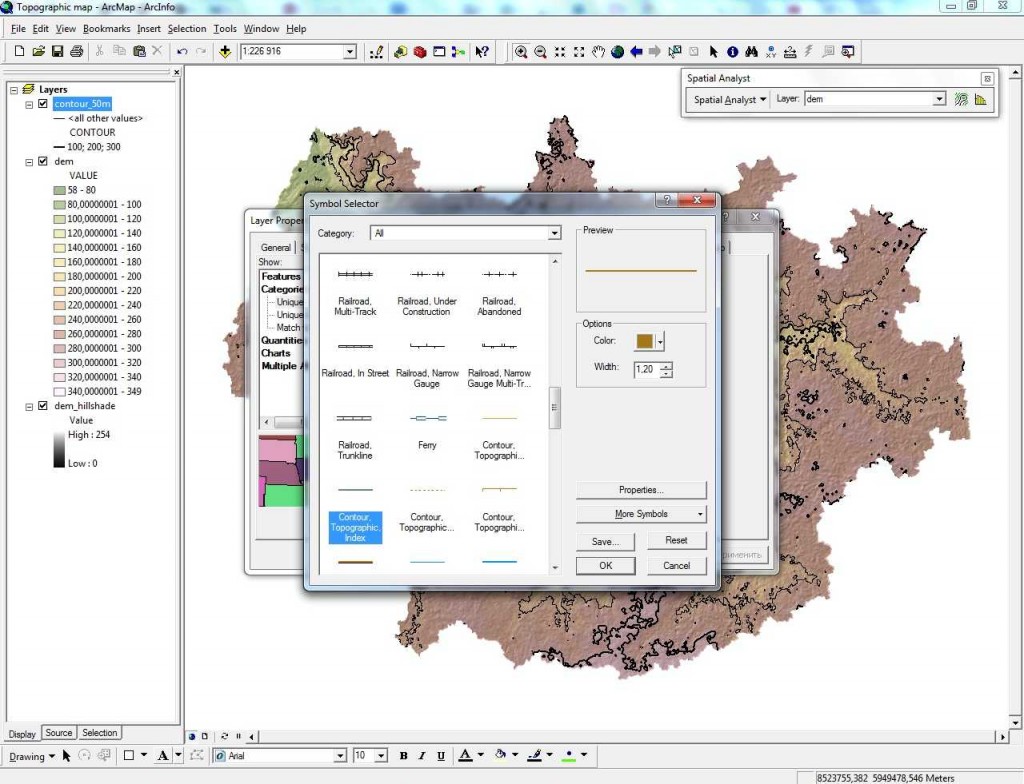
Figure 18
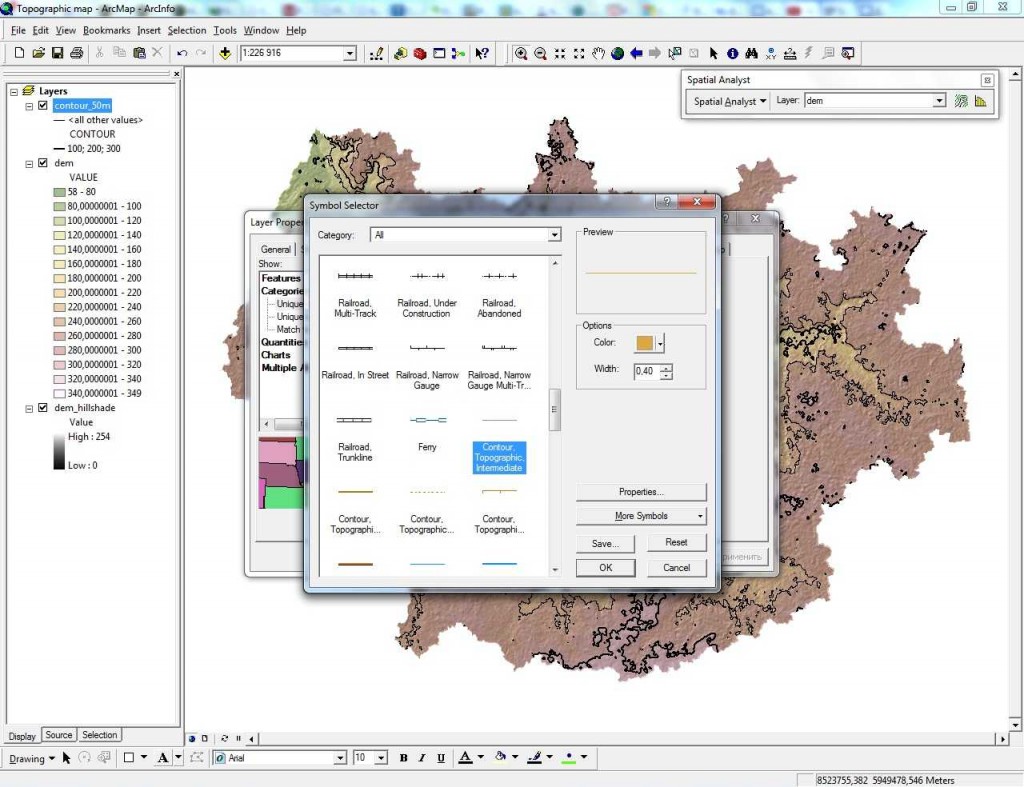
Figure 19
And that’s it! We have a simple topographic map (Figure 20).
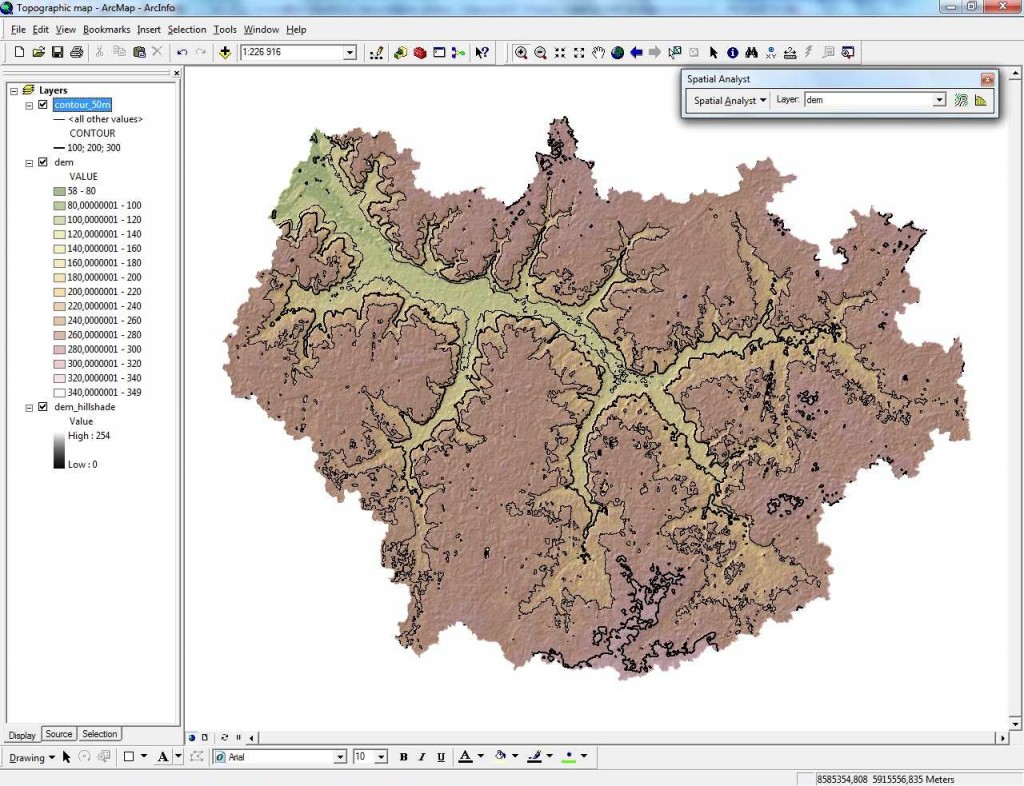 Figure 20
To be continued
All the best and good luck!