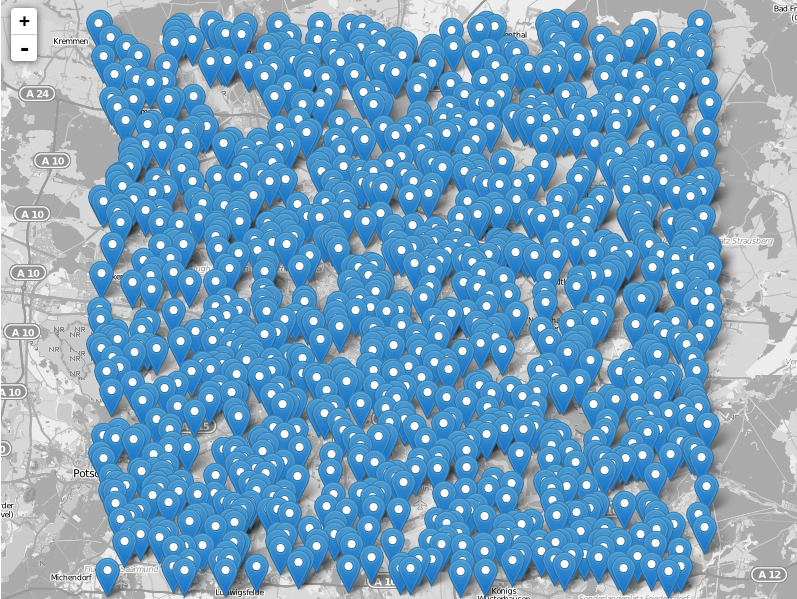
The leaflet API is very simple and tries to deliver best performance and style for commonly used features like tilelayers, points and lines and markers in general. So when we would like to visualize points it is possible to have a very large numbers of points. So lets have a look on such an basic example. I’ve created a point shape file with QGIS which has approx. 1.000 points embedded.
Let’s have a look on a normal webmap with this density of information:
<!DOCTYPE html>
<html>
<head>
  <title>Marker Cluster Webmap</title>
  <meta charset="utf-8" />
  <link rel="stylesheet" href="http://cdn.leafletjs.com/leaflet-0.6.2/leaflet.css" />
</head>
<body>
  <div id="map" style="width: 500px; height: 500px"></div>
  <script src="http://cdn.leafletjs.com/leaflet-0.6.2/leaflet.js"></script>
  <script src="points_rand.js"></script>
  <script>
	var map = L.map('map');
	L.tileLayer('http://{s}.www.toolserver.org/tiles/bw-mapnik/{z}/{x}/{y}.png').addTo(map); //will be our basemap.
	var points_rand = new L.geoJson(points, {
	onEachFeature: function (feature, layer) //functionality on click on feature
		{
		layer.bindPopup("hi! I am one of thousands"); //just to show something in the popup. could be part of the geojson as well!
		}
	).addTo(map);
	map.fitBounds(markers.getBounds());
  </script>
Our first webmap with many points in Berlin.
 </body>
</html>
As you can see, we’ve inlcuded a second js file with the point information called points_rand.js. You probably agree, that this is too much information. To reduce the density without loosing too much information is a cluster strategy that combines markers that lie in a certain radius. It was developed by David Leaver and is maintained on github. For this functionality we will need two stylesheet files (*.css) and a javascript file for the clustering process itself:
<link rel="stylesheet" href="MarkerCluster.css" />
<link rel="stylesheet" href="MarkerCluster.Default.css" />
<script src="leaflet.markercluster-src.js"></script>
So in the first place we will create a cluster object and add the geojson object to this cluster object:
var markers = L.markerClusterGroup();
var points_rand = L.geoJson(points, {
	onEachFeature: function (feature, layer) //functionality on click on feature
		{
		layer.bindPopup("hi! I am one of thousands"); //just to show something in the popup. could be part of the geojson as well!
		}
});
As for every map element we need to add it to the map and in the last place we will set the view on the map to the extent of the cluster object:
map.addLayer(markers);		// add it to the map
map.fitBounds(markers.getBounds()); //set view on the cluster extent
Enjoy this short work on BigData here:
Find the zip file with all files needed here on Digital Geography.
For further information on the usage check the github page of the project which also shows some real big data exmples. Another example on listed elements was done by Norwegian blogger Bjørn Sandvik.
If you have any questions don’t hesitate to drop us a comment or contact us directly.
Hey @disqus_Sq3X3rzFfa:disqus, your markercluster template doesn’t work properly. By clicking on the 908 cluster a polygon appears. Also you should fix the appearance of the html code in the top section.
the polygon that appears is part of the leaflet API –‘ it is normal, and allows the viewer to know the geo extend of the data
Oh ja! You’re totally right!
Is there a way to disable the polygon that appears ?
L.markerClusterGroup({
showCoverageOnHover: false,});
great example, thanks!
Awesome. Thanks mate!
Please check out site doing the same thing with much bigger 1.5 million data points:
http://www.bdvengine.info:8080/bdvengine/BDVMap.html
Hi,
I understood as, currently marker cluster are working based on particular distance, right?
I want to cluster markers based on region, for example cluster all markers in a country or state.
Can anyone help me!
Thanks,
Rajavelu
I want popup to be opened on click on cluster group instead of children. On children popup is working fine.
http://stackoverflow.com/questions/32067832/leaflet-markercluster-popup-on-hovering-over-cluster-group