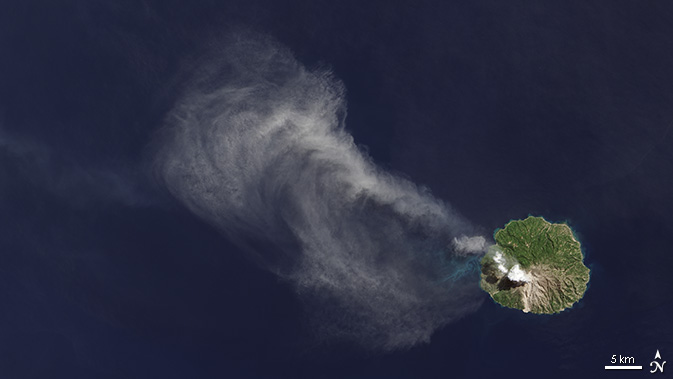
flickr through SRTM and GDEM on an alluvial fan in central Mongolia
Some time has past since I last wrote a DEM comparison, comparing ALOS World with SRTM 1 and GDEM V2 with SRTM 3. But as NASA and METI released the lates version of the ASTER GDEM dataset, I will compare this once again for a certain area in central Mongolia. But this time, the competitor will be SRTM 1.
Compared to Version 2, Version 3 has a decrease in elevation void area due to the increase of ASTER stereo image data and improved process, and a decrease in water area anomaly data due to using new global water body data to be described later.
So overall: If you use more scenes, it should improve the quality, shouldn’t it?
this dataset has a ground resolution of approx. 30m and looks good at first sight. I will proof the contrary. Yet, I have to admit: If you need elevation data for the non-covered region of SRTM this might be a first good startimg point to look at.
water bodies
Let’s quick check the water-body statement first: Yes, I can see a perfectly flat surface at the lake Ogii Nuur.
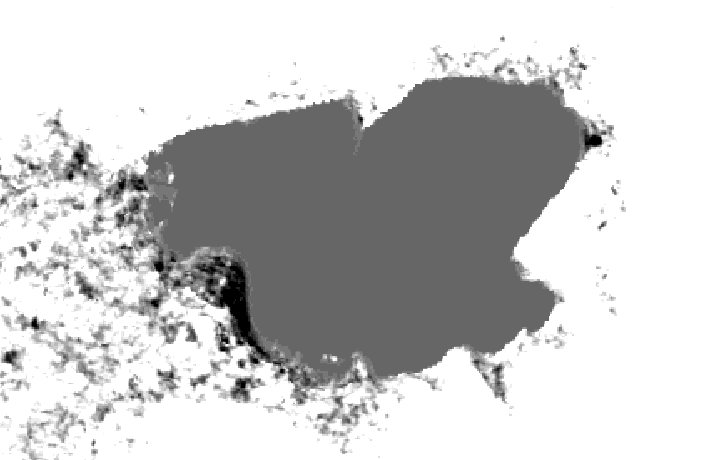
contrast enhanced subset for lake Ogii Nuur (1321m asl) with a b-w stretch of 1315m to 1330m
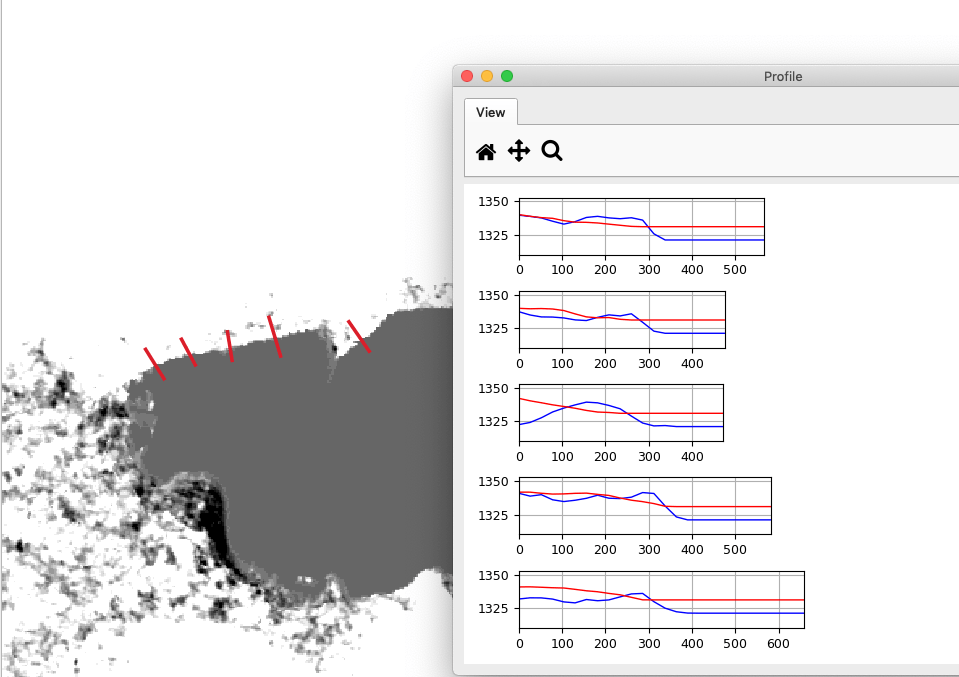
If you look closely on the lower left corner of this scene: there is an area that should be flooded, right? nearly 15m below the surface of the water body. And if you check the shore, you will see some “burn effect” for the water body. The GDEM values plunge from 13xxm to the water level at 1321m on a very short distance (blue profiles for GDEM, red ones for SRTM):
profiles along the shore
As you can see here, and here, the topography is not that slopy at the shores of the lake. The level of Ogii Nuur is approx. 10m lower compared to the level in the SRTM scene and Wikipedia mentions the surface elevation with 1337m, which is quite similar to the SRTM value with 1330m.
nasty artefacts
Now let’s move along the Orkhon river towards the south. The GDEM DEM is a DEM processed with images instead of radar or other nasty stuff. And the number of images heavily affects the scene. In the next image you see the number of scenes used for the DEM processing and the slope values of the scene. There are quite some footprints or stripes visible:
GDEM V3: slope vs. number of scenes
flat surfaces
The Orkhon Valley is covered with thickdeposits of Quaternary unconsolidated sediments. Well-rounded basal-ticfluvial deposits that include rocks from a phase of middle to earlyPleistocene volcanic activity and alluvial deposits alternate with loessand glacial loams rich in calcium carbonate
paper
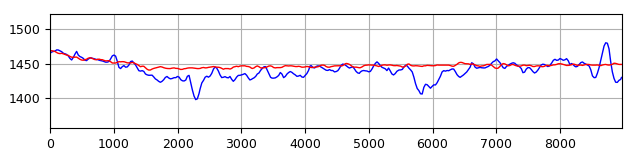
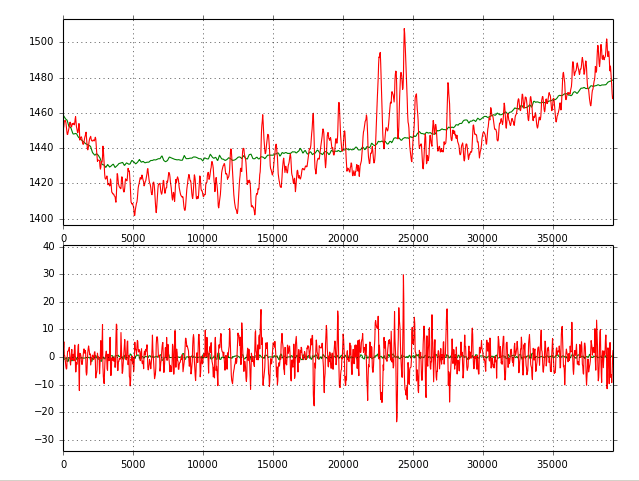
So we should assume a leveled topography. But contrary we some artefacts here as well:
slope profile, blue: GDEM v3 red: SRTM 1
. If we recalculate the black-white, stretch the differences are very easy to see:
flickr through SRTM and GDEM on an alluvial fan in central Mongolia
tldr
Once again, ASTER GDEM, even in the version number three, should be used with caution. It looks promising and good in first place. But if you analyze the slope, you will see the dark side of this dataset. It might be a good starting point if you’re interested in the topography of a piece of land in the upper north our lower south hemisphere as SRTM is only available below 60 degrees North and above 56 degrees South. Furthermore we need to be aware that the topography of some regions is changing quickly and we need to keep in mind, that the SRT-Mission is already 19 years old. But once again: SRTM 1 and 3 is still gold standard in my point of view.
I was recently reading the 2012 article by James R. Irons and colleagues describing the Landsat-8 mission (or Landsat Data Continuity Mission, LDCM, as it was then called)¹.…
Let’s get ready to rumble! No, just kidding. We are all excited about the recent message from the white house: SRTM “1” (1 equals 1 arcsecond, whereas 3…
With this post I would like to come back on a topic from September 2014. In this blog post on Digital-Geography I announced that from September 2014 until…