SAR images can see through clouds and in darkness, and are therefore very useful for operational monitoring of our seas. Detecting ships, icebergs, wind patterns, and oil spills is daily business in Europe with the Sentinel-1 satellite. Want to see for yourself how to extract information from a SAR image? In this tutorial, we’ll use the SNAP toolbox for Sentinel-1 to extract information on the number of ships at sea.
Overview
SAR images are often used for monitoring ship traffic, oil spills, and conditions at sea, because they can see through clouds and darkness, and the waves a SAR satellite like Sentinel-1 emits, can be used to detect small objects and oil spills, while covering a large area. In this tutorial, we’ll be extracting information from Sentinel-1. The tutorial describes how to extract information on ships in a Sentinel-1 image, but you can use the same method to find oil spills, and estimate wind speed and direction at sea at the time the image was taken.
Getting the data and the tools
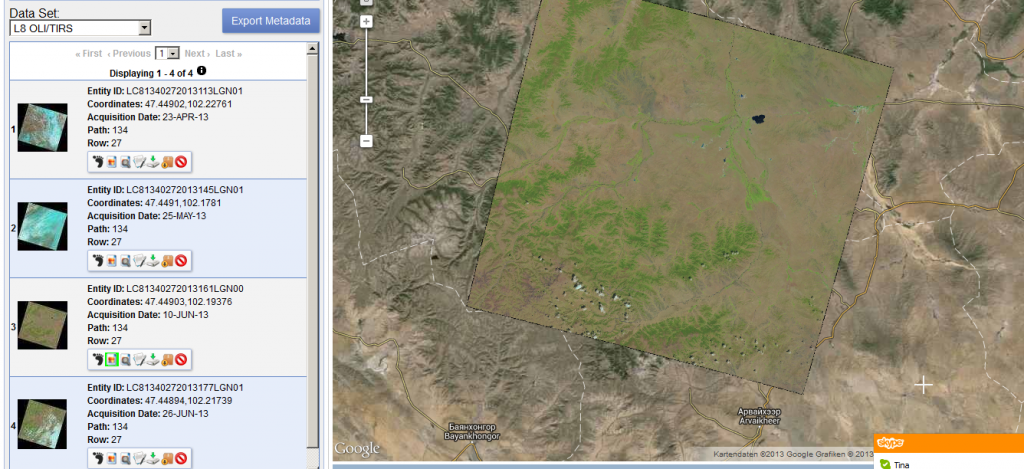
For this tutorial, I downloaded a Sentinel-1 image from the English channel – lots of ships there – taken on 13 March 2016. If you want more info on how to look for images and download them, check this out. Make sure to get an image that starts with S1A_IW_GRDH as that’s the format we’ll be working with.
Also, download the software we’ll be using today from this website. One Toolbox can process the images of all the Sentinels, whether they are optical or SAR images. You can choose which features you install during the installation process. For this tutorial, you only need the Sentinel-1 toolbox.
Time to see that image!
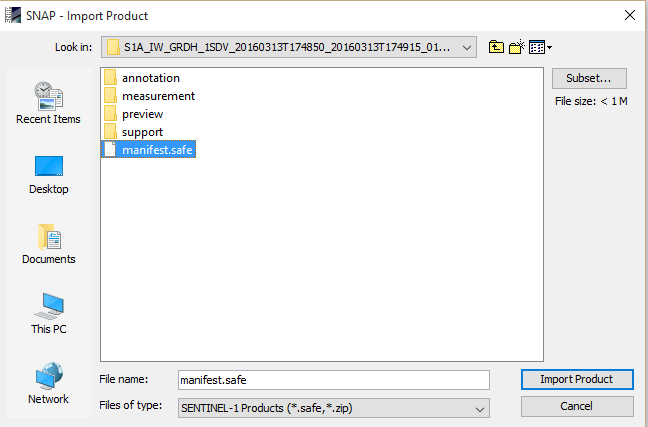
Once you’ve got all the tools and data, open the SNAP toolbox, and import the image through File –> Import –> SAR Sensors –> Sentinel-1. You can import the zip file you’ve downloaded, or, if you’ve already unzipped it, just go into the folder and find the manifest.safe file.
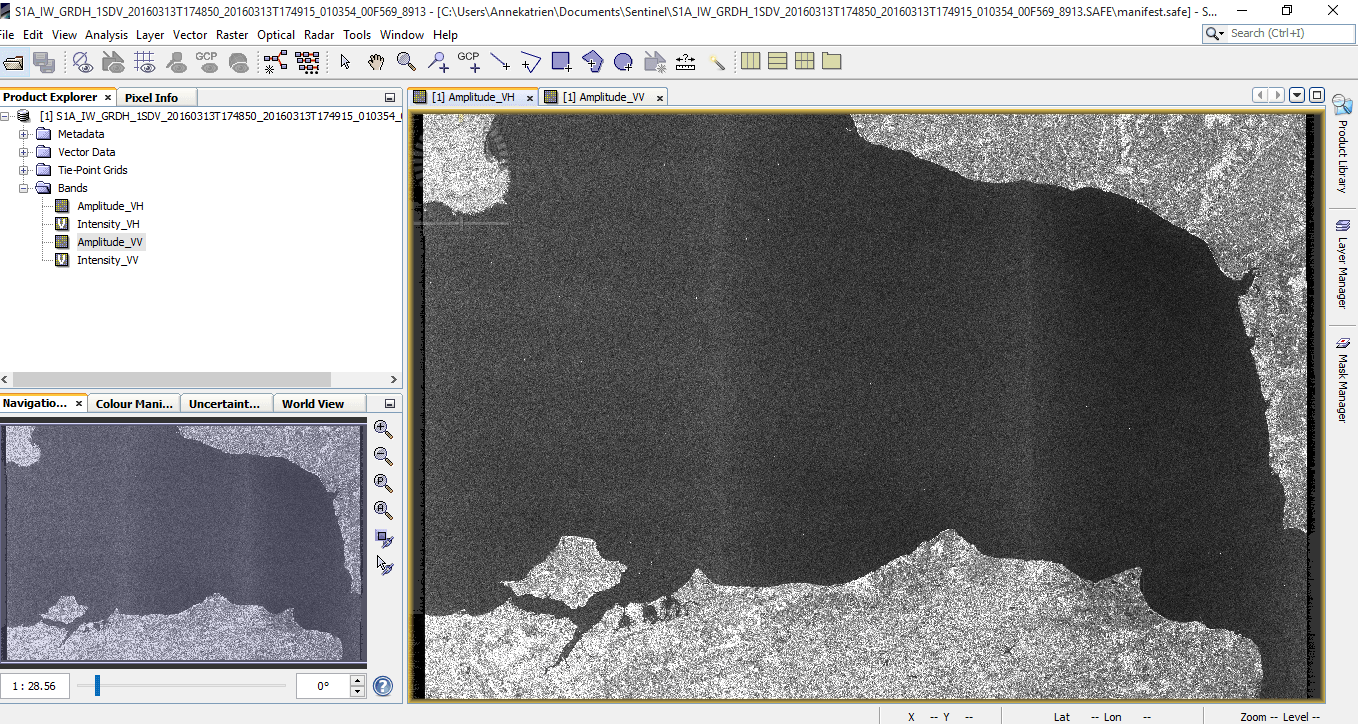
The image will open in the Product Explorer side bar on the left. Feel free to have a look around the different folders, where you’ll find all the details on that Sentinel-1 image you’ve always wanted to know – or not.
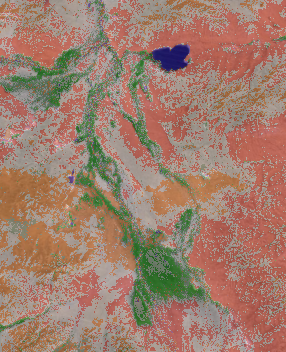
The most interesting folder is the last one – Bands. Open it and double click one of the bands to open it in the Viewer. Be aware that this is not georeferenced, so you have to use your imagination to see which way is up. There are ways to georeference the image, but as our ship detection results will come out just fine without georeferencing, we’re going to skip this step here.
Preparing your data
Before we can do the actual detection, we do need to work with the image a bit. Any satellite image is delivered with DN numbers, the values of each pixel within the image. Those DN numbers don’t mean anything in physics, and the ship detection algorithm is based on an analysis of the physical properties of each pixel. We therefore have to calibrate the image first.
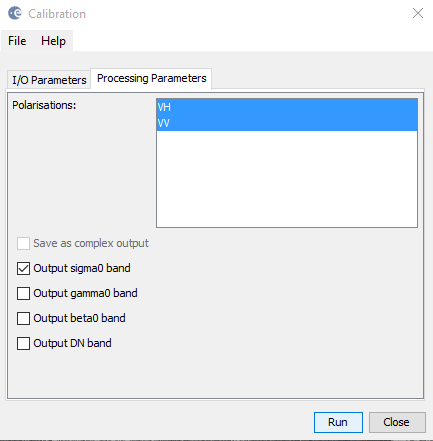
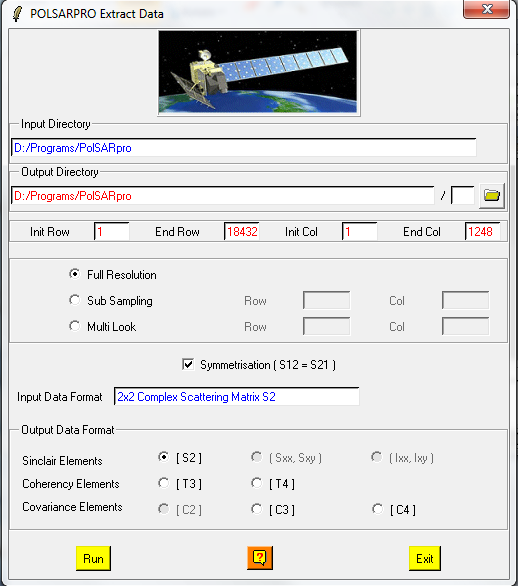
Go to Radar –> Radiometric –> Calibrate.
You don’t need to change the parameters on the first page. Switch to the second tab, and select both VH and VV (Control + click). The parameter we need is Sigma0. When you’ve done that, press Run.
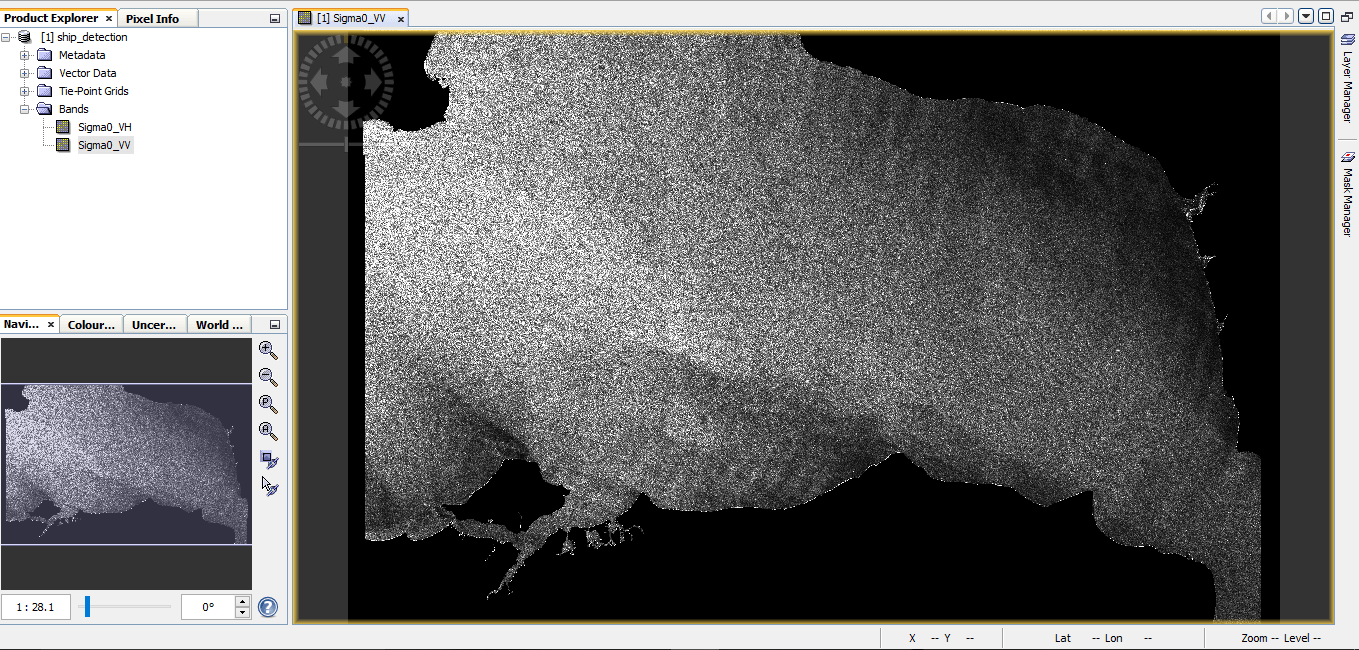
A second product will open in the Product Explorer window.
Extracting ship information
Now we’re ready for the ship detection. If you’re curious about the physics behind it, the Help section in the SNAP Toolbox gives a good overview of the Object Detection algorithm used.
Go to Radar –> Feature Extraction –> Ocean Tools –> Ocean Object Detection.
* Make sure that the name of the Source Product in the first tab is the name of the calibrated image, not that of the original image.
* I selected the Sigma0_VH band as the Source Band for the land-sea mask
* No need to change any of the parameters in the other tabs, but make sure you note in Tab 5 where the result will be stored on your computer. The default is your user folder (C:/Users/username in Windows).
And click Run.
Now – it took my computer nearly 4 hours to run the object detection. So run it overnight if you can, or while you can wait and leave your computer be, because the toolbox takes up a lot of memory.
Unless of course, your computer is better than mine :).
To visualize the results, open a band of the ship detection results from the Product Explorer window. Now, go to the Layer Manager, in the sidebar all the way to the right. If it’s not there, you can find it under Layer –> Layer Manager.
Press the plus icon.
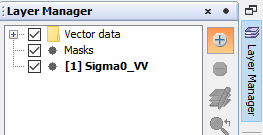
When the Add Layer window appears, add the Object Detection Results.
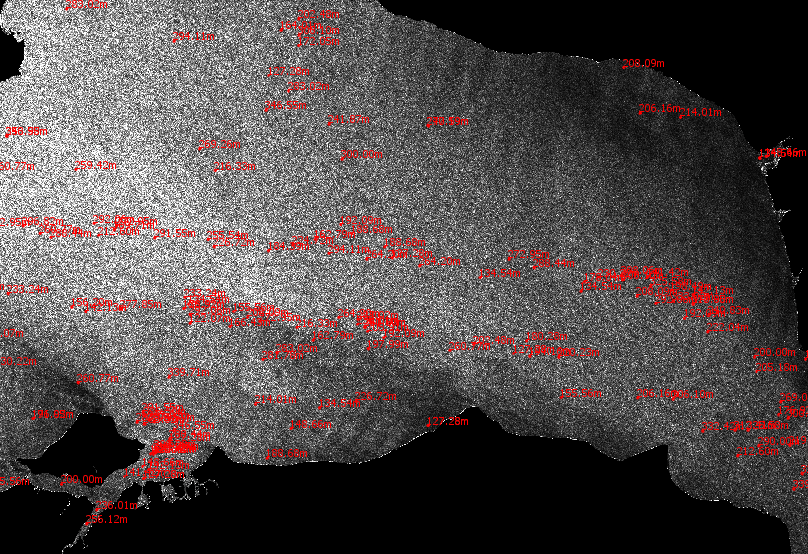
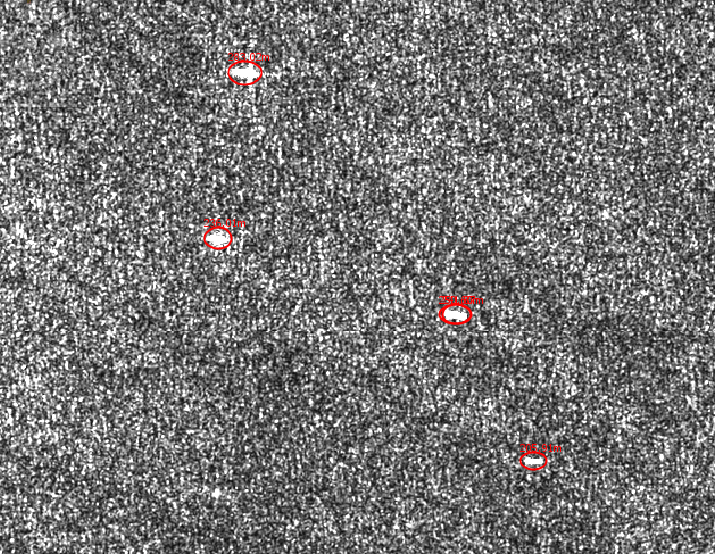
Not the nicest overview, and besides, our image is still flipped.
Making the ship detection results look better
So let’s open the results in something like QGIS. For this, find the object detection XML in your files. As a default, they’ll be placed under C:\Users\username.snap\var\log, or however your user folder is called.
I’ve imported the XML file in LibreOffice Calc, by using the “=” sign as a delimiter. Excel should have an XML import function. Make sure it looks something like this:
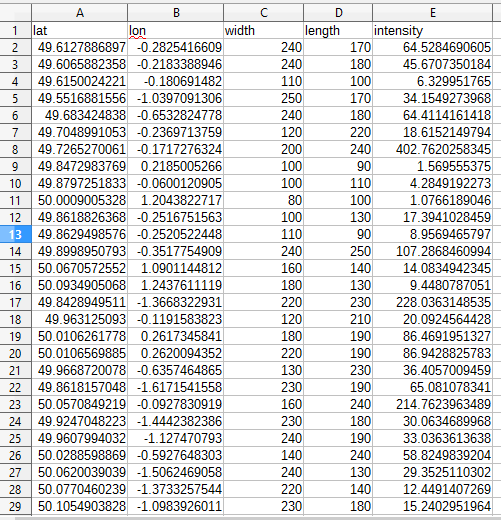
and save it as a CSV file.
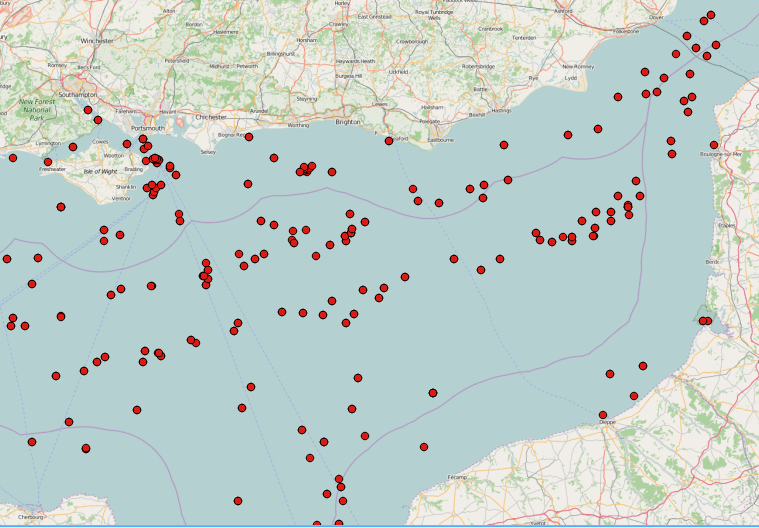
This can easily be imported into QGIS. I’ve added the OpenStreetMap tiles as a background, and ended up with this:
Let me know how it works for you! You can also play around with other feature extraction tools in the SNAP Toolbox, the methodology remains the same.

Excellent article, thanks Annekatrien. The size of Sentinel-1 images is a problem, one solution is that after you have done your processing save your image as a GeoTiff and import into Google Earth Engine.
Thanks Conor, I’ve just signed up for Google Earth Engine and will give it a try!
Thank for sharing this important document. Could you Please, if you have documents or manual how to extract soil moisture from the Sentinel-1 share?
Interesting application. Have you done any application on oil spill detection? that will be great to see too. Cheers
Haven’t tried it in SNAP, but it’s in the same toolset as the ship detection.
Sir I tried a lot of work for oil spill but after the oil spill detection process it’s just showing ship as result can you give some suggestions to me to correct it
Waiting for ur valuable support to my project work
can we process level 0 sentinel 1 data using SNAP?
It’s not possible to get level 0 data as far as I know. Or do you mean SLC data?
how do i view the Slc data after applying corrections and multilooking?
Are you working in SNAP? Because any new data that you’ve created should pop up in the layer window on the left hand side, and if you expand it, you’ll find the result under “Bands”. Double-click that, and it should start loading in your viewer.
ya i tried the same but the sigma0_vv looks simply dark. i tried add the elevation bands after debursting and it came out as 3 bursts is it the bands related to 3 subswaths.Can i merge that 3 bands together
I don’t have much experience with debursting, so I’ll refer you to the SNAP forum http://forum.step.esa.int/, hopefully they can help you!
How to extract elevation details from DEM using SNAP
Very good. Do you have a tutorial to identify vegetation and soil moisture?
I’m working on a tutorial on agricultural monitoring for the moment, so it’s related to your question. Anything specific you’re thinking of with vegetation and soil moisture?
Vegetation I’m interested in identifying is typical of humid environment, where the water table is near the surface and correlate with the soil. Can help, I thank you. Thanks for your interest in my question.
Also, I do not know if it’s the case, to achieve the co-registration procedure (geocoding).
Hello
It is very helpful.Do you have any article to classification of crops and their growth monitoring , using sentinel 1 data .
I will be thankful if you suggest any idea.
Thanks
thanks a lot Annekatrien! this tutorial was interesting. I might have a question for you…Do you know if S1 can obtain images into the open sea?
[because i think that can get only images close to the coast so in that way is kind of imposible to detect ships position when they are far from the coas]
Cheers =)
Hi Anne, thanks for the tutorial. I have been working on different aspect though, most of the time in tropical region there is cloud cover, therefore, its hard to use sentinel-2 or landsat-8 for landcover classification. I am trying to do a change detection analysis do you think S1 imageries could help me in detecting deforestation over time, A tutorial for that too would be appreciable. 🙂
Hi Annekatrien, great job, can you recommend a tutorial for soil moisture estimation. Thank you
Hi Anne, thanks for this tutorial. I have been follow this step, but I get different data. I can’t find the intensity on my workspace. But I get x and y value. How come? Can you help me solve this problem? Thankyou 🙂
Hi Annekatrien, thanks for the nice blog. I was following the described procedure for ship detection in SAR images on sentinel-1 dataset. However, for me it took roughly 63 hours to generate the result on a single dataset. However, the output is also wrong as instead of detecting ships in deep sea, the detected ship locations lie on land. So,could you please let me know the possible reason behind this? Also, while applying land-sea mask, how to configure SRTM-3 sec with the software as I want to run the SNAP software offline. It would be great if you could provide… Read more »