This week the MOOC will concentrate on patterns and hypothesis about patterns. Exercises will concentrate on “hotspots” and patterns in crime analysis. So the keyword in this lessons might be visualization. As it often defines our visual footprint the MOOC also focusses on classification approaches.
ESRI’s MOOC infrastructure
In the last weeks it was a little bit hard to understand the quizzes and the explanation for a right or wrong answer. In this week the quizzes have commented answers which explain why you answered wrong or right. This is a big improvement. Unfortunately only 500 members seems to take part in the MOOC in an active way. The MOOC will be available till the 29th of October so everyone can finish the examples and quizzes to get a certificate. Furthermore first names are in the discussion to get a one-year ArcGIS online license for free. You are invited by ESRI to throw in some names or to nominate yourself.ESRI’s MOOC content

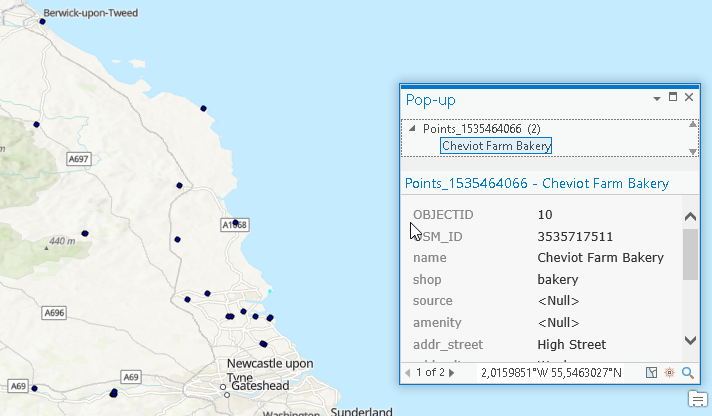
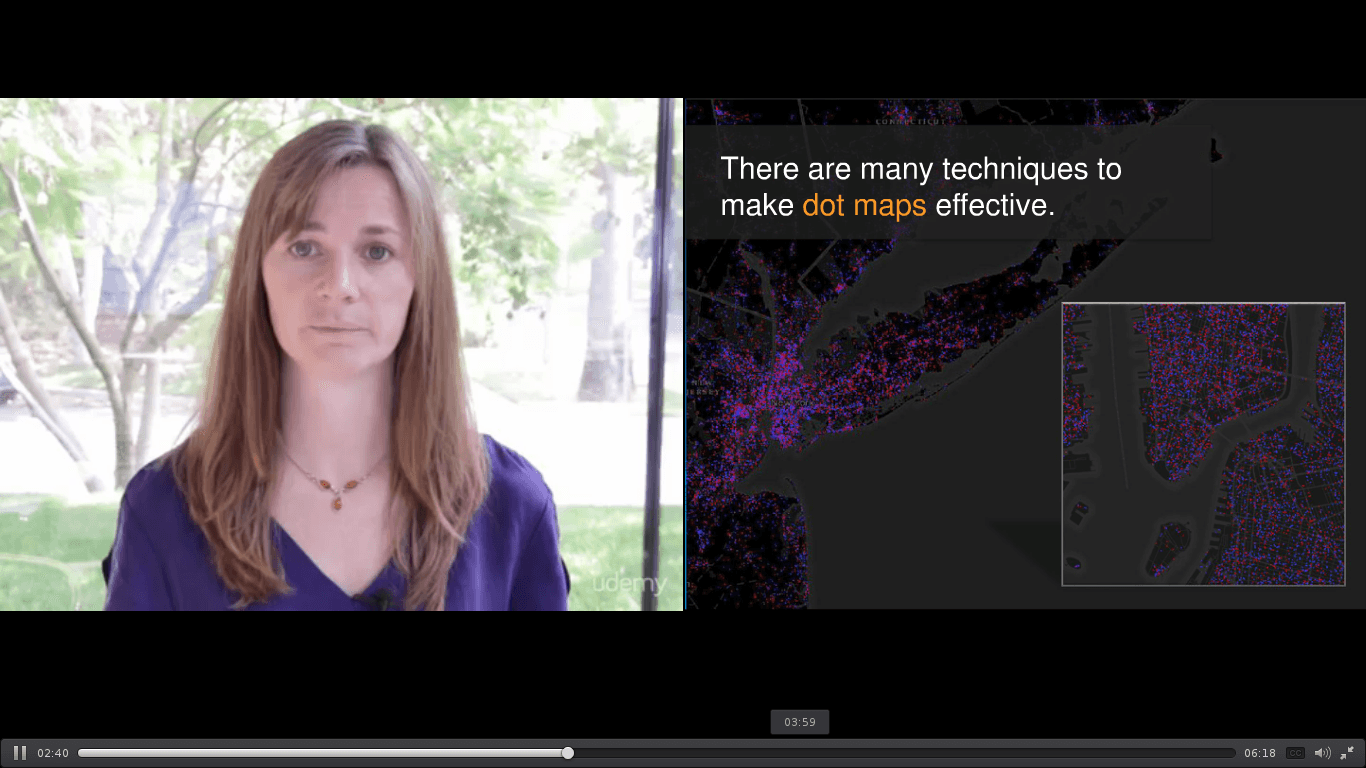
In the first section Linda tries to raise your awareness for the problem of classification and patterns. When she shows patterns she also ask you to keep in mind the bounds of your view: looking at the densities of apartment buildings in a Berlin suburb might look regular or maybe equally distributed. But when we look at the same pattern with a brighter view and seeing also the suburbs and the surrounding landscape we would prob. say that this observed pattern is clustered as there are many other places in view where we don’t see any apartment buildings at all. The concept of kernel density functions is shown but to me it was a shame that the well-known “heatmap” was not introduced and compared with the kernel density map. Furthermore the influences off kernel shapes would have been an interesting plus. She also described and showed different classification approaches and compared the visually to each other. There was also a great question in the Udemy forum: “How to select [a] classification system?” If you know an answer: Let us know by commenting or answering on Udemy. The first exercise will focus on intersections, filtering and creating density maps:
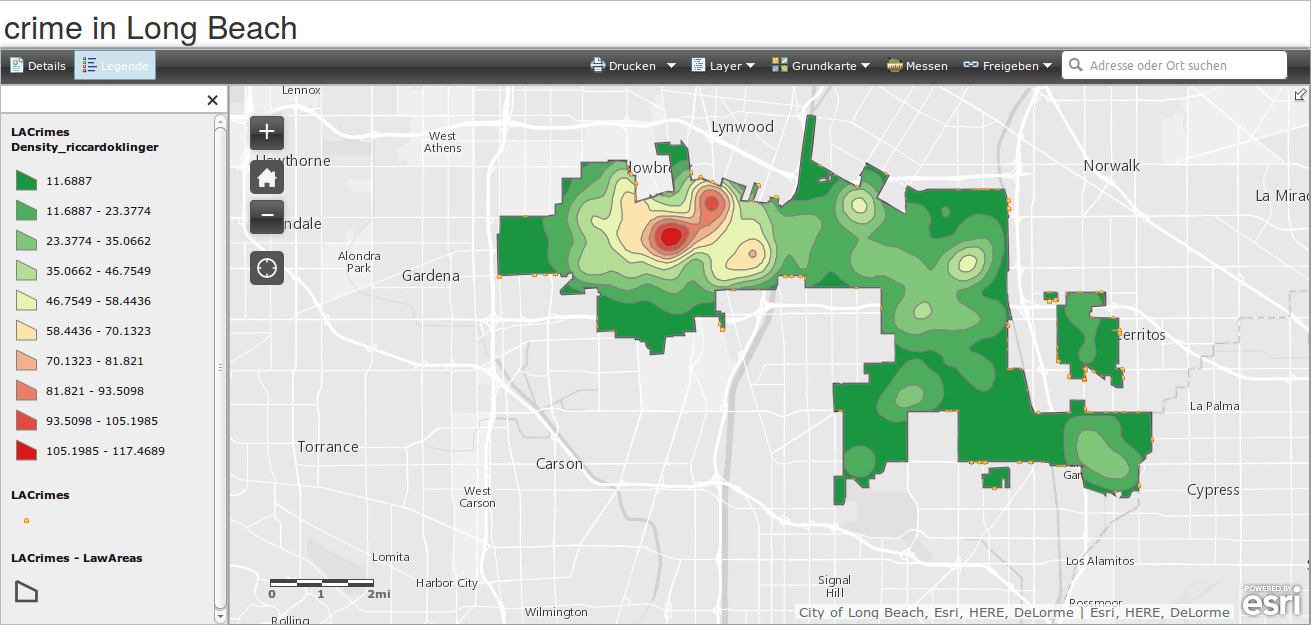
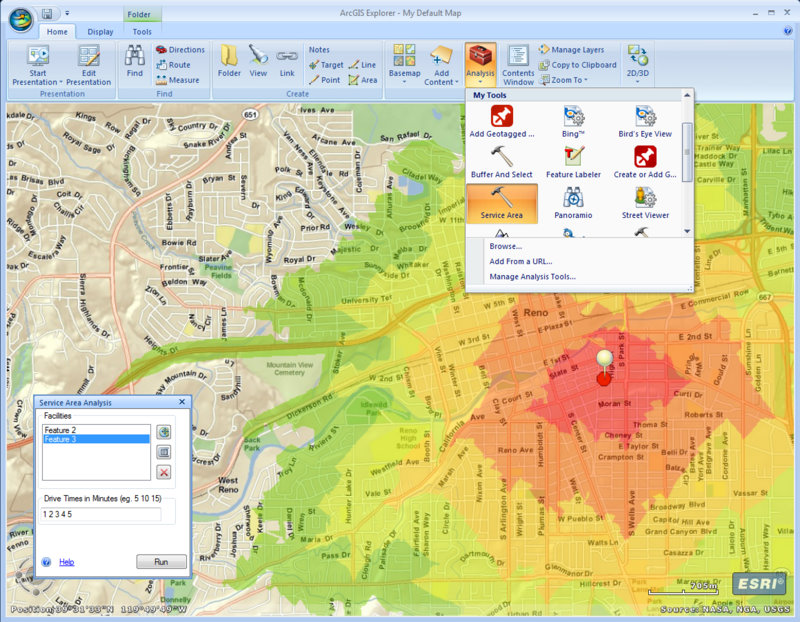
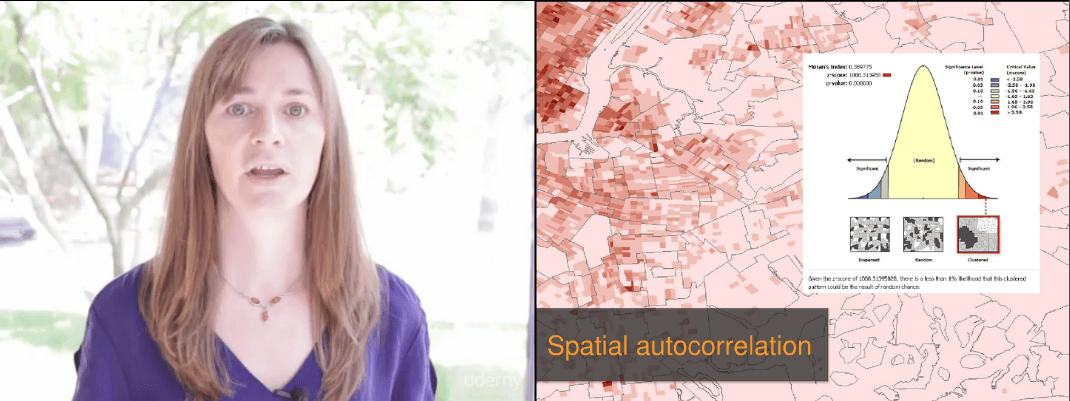
The second part concentrate on pattern, spatial autocorrelation, hot spot analysis and time series. Furthermore she introduces automation of processes and its advantages. Once again: watch your data, discuss your results and choose the way of visualization wisely. In the second exercise you will perform an analysis on hot spots of crime areas.
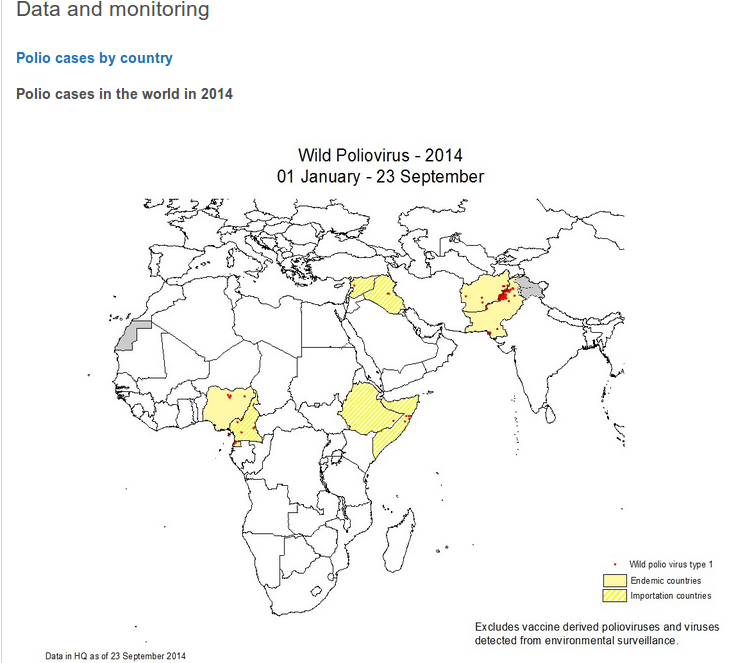
This weeks guest lecturer is David Gadsden from ESRIs Non-Profit program. He presents some global organisations by name dropping and slightly gives an insight in one of those NGOs (namely the Global Polio Eradication Initiative). Unfortunately this guest lecture was not helping me in getting a real insight into the usage of spatial analysis in this NGO. Furthermore: visit the the site and search for a map. A quick walk on the website just revealed one map which clearly is not ESRI made…