Within this, 2nd basic D3 tutorial, I will show you how to combine D3 with Leaflet whereby each library can demonstrate its vantages!
These will be the main topics:
- Set up a map using Leaflet
- Add an individual zoombar
- Show the center of the map
- Show the extent of the map
- Get a 1st impression of d3.scale()
When you are not familiar with D3 or Leaflet I recommend you to apply these tutorials, previously:
Set up a map using Leaflet
Let’s begin by setting up an html-file containing a very simple map. How this can be done, was already described by Riccardo … so I ‘ll use this example with a few changes:
- without data overlay
- set Leaflet to the latest version
- add d3.js
<!DOCTYPE html>
<html>
<head>
  <title>Testmap</title>
  <meta charset="utf-8" />
  <script src="http://cdn.leafletjs.com/leaflet-0.6.1/leaflet.js"></script>
  <script src="http://d3js.org/d3.v3.min.js"></script>
  <style>
  @import url(https://cdn.leafletjs.com/leaflet-0.6.1/leaflet.css);
  </style>
</head>
<body>
  <div id="map" style="width: 960px; height: 300px"></div>
  <script>
  var map = L.map('map').setView([52.45,13.4], 9);
  var toolserver = L.tileLayer('http://{s}.www.toolserver.org/tiles/bw-mapnik/{z}/{x}/{y}.png').addTo(map);
  </script>
 </body>
</html>
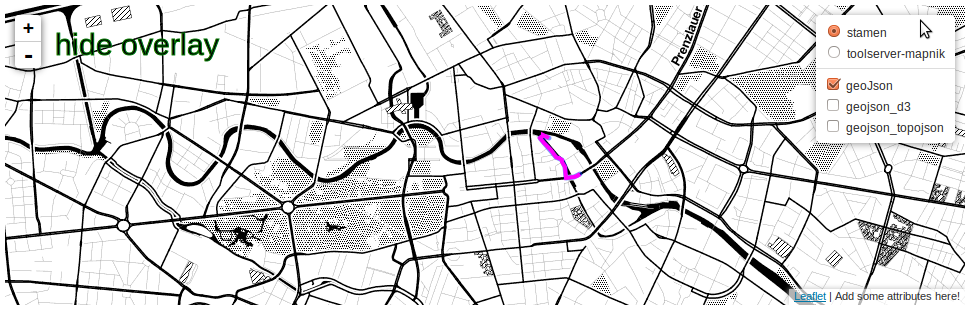
Basically, I’d like to have another layer! So we’ll add another layer (from ‘stamen’) and add a layer switch:
var map = L.map('map').setView([52.45,13.4], 9);
var toolserver = L.tileLayer('http://{s}.www.toolserver.org/tiles/bw-mapnik/{z}/{x}/{y}.png');
var stamen = L.tileLayer('http://{s}.tile.stamen.com/toner/{z}/{x}/{y}.png', {attribution: 'Add some attributes here!'}).addTo(map);
var baseLayers = {"stamen": stamen, "toolserver-mapnik":toolserver};L.control.layers(baseLayers).addTo(map);
L.control.layers(baseLayers).addTo(map);
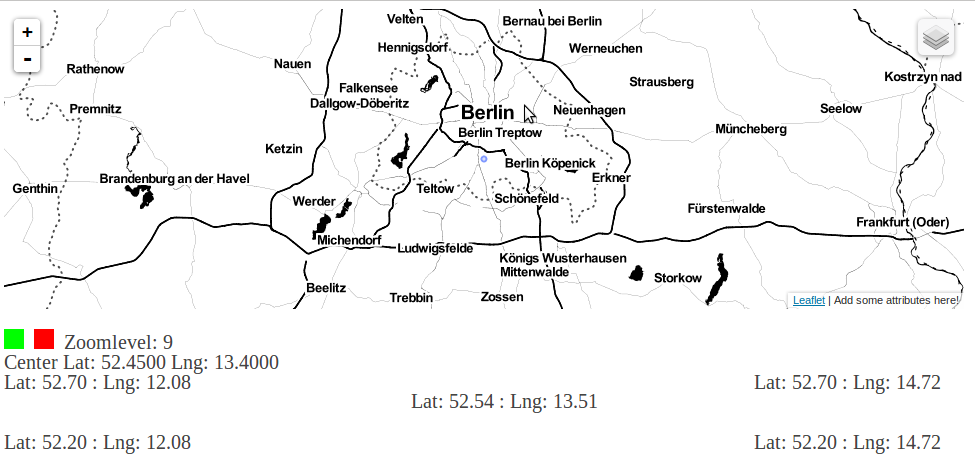
Your ‘simple’ map example should look now something like this:
(I just made it not so wide, to fit into this window)
OK … let’s add a simple, individual zoombar to the map, using D3!
Begin, by adding a ‘div’-element to the body. It acts like a container, so we’ll name it ‘container’…
var container = d3.select("body").append("div").attr("id","#container");
… and the same for a ‘svg-container’ element, notice that the ‘svg’-element needs extents!
var svgContainer = container.append("svg").attr("width", 960).attr("height", 200);
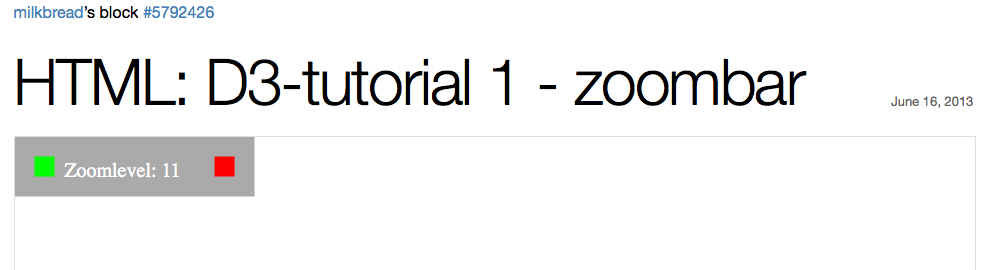
Now, we add the steering elements and a textual indication of background information!
- Zoom in
var zoomIn = svgContainer.append("rect")
.attr("x", 0)   .attr("y", size)
.attr("width", size)
.attr("height", size)
.style("fill","#0f0")
.on("mouseup",zoomInAction);
- Zoom out
var zoomOut = svgContainer.append("rect")
.attr("x", size+10)
.attr("y", size)
.attr("width", size)
.attr("height", size)
.style("fill","#f00")
.on("mouseup",zoomOutAction);
- Text
var zoomText = svgContainer.append("text")
.text("Zoomlevel: "+map.getZoom())
.attr("x", (size * 2)+20)
.attr("y", size * 2)
.style("fill","#444")
.style("font-size","20");
Maybe you have already realised … there are some variables that were not alocated so far. We have to define the ‘size’ value…
var size = 20;
… and we need the functions for interaction.
function zoomOutAction(){
 anotherFunction(-1);
}

function zoomInAction(){
 anotherFunction(1);
}

function anotherFunction(value){
 var newZoomlevel = map.getZoom() + value
 map.setZoom(newZoomlevel)
 zoomText.text("Zoomlevel: "+newZoomlevel)
}
I prefer to have a function for each interaction (‘zoomOutAction’ & ‘zoomInAction’) and one function that executes both interactions (‘anotherFunction’). You can see … when you click on the ‘zoomIn’-rectangle … the function ‘zoomInAction’ is executed … that executes the function ‘anotherFunction’ with the value ‘+1′ … what results in increase of the current zoomlevel of the map. Same principle but other values for ‘zoomOut’!
Cool … not stylish but ‘handmade’ 😉 Now you surely ask yourself: “Is there more information that we could display?”
Yes…a lot, just have a look into the documentation. I will just show you two more examples on how to get and show them:
- the center of the map
map.getCenter()
- the extent of the map
map.getBounds()
Show the center of the map
First of all … we need a text element, that will show us the information…
var centerText = svgContainer.append("text")
.attr("x", 0)
.attr("y", size * 3)
.style("fill","#444")
.style("font-size","20");
… and a function that does the action stuff…
function showCenterInfo(){
 centerText.text("Center Lat: "+map.getCenter().lat.toFixed(4)+" Lng: "+map.getCenter().lng.toFixed(4))
}
… we want to see the initial values, so call the function directly after you’ve initialised the ‘text’-element ‘centerText’.
showCenterInfo();
Aha … but this information is static … hmm … a ‘button’ to call the function would be a solution … but … an elegant solution would be to react on map interactions, right?
Let’s do it!
Leaflet offers you some ‘action listeners’ (see documentation) that let you know, when you have to update the relevant information. We have to update the ‘centerText’ (means: call the corresponding function ‘showCenterInfo()’) when the map was:
- dragged
map.on("drag", showCenterInfo);
- zoomed in/out
map.on("viewreset", showCenterInfo);
These lines can be added anywhere, but it is more clear to add it in the near of the ‘map’ definition.
One small addition … let’s add a tiny, cute center point, what about that? So…making this in D3 would be too early, as it is a little bit more complicated…hey…we still have Leaflet as option, and are ready to use it 😉 … have a look a the documentation … and …
L.circle([map.getCenter().lat, map.getCenter().lng], 200).addTo(map);
…add this line to the function ‘showCenterInfo()’ … try it and move the map … ah, funny, isn’t it … but … be a smart JavaScript developer, have a short look into your development window and analyze the point elements … upps that’s a lot!!!
I think a static center point is enough … add the previous line to the near of the map definition and alocate it to a variable…
var centerPoint = L.circle([map.getCenter().lat, map.getCenter().lng], 200).addTo(map);
…and change the code within that function dynamically, which is a kind of reset!
centerPoint.setLatLng([map.getCenter().lat, map.getCenter().lng])
Show the extent of the map
Basically, this is just a repetion of the previous code, especially because the actualisation of the information is released by the same interactions.
BUT…we’re here to learn something…so let’s stabilize our knowledge and use another method, we already got to know… d3.selectAll() … do you remember?
As we are going to do a lot of selection stuff … it could be advantagous to have a clean playground … that is why I start by adding a Group (‘g’) to the ‘svgContainer’…
var group = svgContainer.append('g');
…within that group, we can make selections and no (already) existing element will make problems
Start slowly, by examining the available data…
console.log(map.getBounds()._northEast, map.getBounds()._southWest)
…aha…2 Points…wait…
var rectangle = [];
rectangle.push([map.getBounds()._northEast.lat, map.getBounds()._northEast.lng])
rectangle.push([map.getBounds()._northEast.lat, map.getBounds()._southWest.lng])
rectangle.push([map.getBounds()._southWest.lat, map.getBounds()._southWest.lng])
rectangle.push([map.getBounds()._southWest.lat, map.getBounds()._northEast.lng])
console.log(rectangle)
…4 Points…and an array…that reminds me on something…
var coordText = group.selectAll('text').data(rectangle).enter().append("text").text("Hello")
…we have already seen that in the previous D3-Basics-Tutorial, right?
Ok…go on and define the text elements…
coordText.attr("x", 0)
.attr("y", function(data,i){return size * (4+i)})
.style("fill","#444")
.style("font-size","20");
…and check out how to change the text content directly by adding…
.text(function(data){return "Lat: "+data[0].toFixed(2) +" : Lng: "+ data [1].toFixed(2)});
…to the chain!
Aha…hmm…maybe we can use the values directly to define the positions of the text elements…but therefore, we need a scale … or to be accurate a ‘wonderful’
d3.scale()
I’d like to use the coordinates of each extent-point to define the text-coordinates of each extent point. Let’s project these values onto a ‘field’ of this dimension: height=80 width=760 … have a look at the code…
var scaleLat = d3.scale.linear();
scaleLat.domain([map.getBounds()._northEast.lat,map.getBounds()._southWest.lat])
        .range([size*4,size*7]);
…this is the scale for the latitude … you can define a ‘domain’ (your data) and a ‘range’ (the values I want to project them on) … in result, I can scale between both values very, very simple!
For example … get the corresponding latitude of the value ‘100’:
console.log(scaleLat.invert(100))
… or the value of the latitude ‘52.30’:
console.log(scaleLat(52.30))
Add a similar code for the longitude…
var scaleLng = d3.scale.linear();
scaleLng.domain([map.getBounds()._southWest.lng, map.getBounds()._northEast.lng])
        .range([0,750]);
Bring them to the action, by using them to change the coordinate definition of the text elements…
coordText.attr("x", function(data,i){return scaleLng(data[1])})
         .attr("y", function(data,i){return scaleLat(data[0])})
Yeah … that’s cool … but I’d like to have it updated on any map action … therefore we have to throw everything into a function …
function defineExtentVisualisation(){
 var rectangle = [];
 rectangle.push([map.getBounds()._northEast.lat, map.getBounds()._northEast.lng])
 rectangle.push([map.getBounds()._northEast.lat, map.getBounds()._southWest.lng])
 rectangle.push([map.getBounds()._southWest.lat, map.getBounds()._southWest.lng])
 rectangle.push([map.getBounds()._southWest.lat, map.getBounds()._northEast.lng])

 scaleLat.domain([map.getBounds()._northEast.lat,map.getBounds()._southWest.lat])
         .range([size*4,size*7]);
 scaleLng.domain([map.getBounds()._southWest.lng, map.getBounds()._northEast.lng])
         .range([0,750]);

 group.selectAll('text').remove();

 var coordText = group.selectAll('text').data(rectangle).enter().append("text").text("Hello")
 coordText.attr("x", function(data,i){return scaleLng(data[1])})
          .attr("y", function(data,i){return scaleLat(data[0])})
          .style("fill","#444")
          .style("font-size","20")
          .text(function(data){return "Lat: "+data[0].toFixed(2) +" : Lng: "+ data [1].toFixed(2)});
}
…did you notice … as this function will always selectAll text elements and add new for each ‘rectangle’ element, we have to remove all existing before…that is why I added this line…
group.selectAll('text').remove();
…and we have to define the scales outside of the function, so I’ll do that directly after adding the group to the svgContainer…
var group = svgContainer.append('g');
var scaleLat = d3.scale.linear();
var scaleLng = d3.scale.linear();
…and finally we have to call the function within the existing function for map-interaction ‘showCenterInfo’…
defineExtentVisualisation();
…that’s it…now the info on the extent should be update each time a interaction with the map happens!
I think/hope, that you have now a good knowledge base for being able to play with D3 & Leaflet on your own!
You’ve got no idea for something else? … What about an additional information on the mouse position when you move it over the map?!? Here’s what you’d need for that:
- a ‘text’ element that will show the mouse coordinates –> ‘currentPos’
- a Leaflet ‘action listener’ –> ‘mousemove’
- a function that is called by the ‘listener’ –> ‘setCurrentPosition’
I’ve added this to the final html-file of this tutorial … I hope you’ve liked it 🙂
In the next tutorial, I plan to show you how to use combined D3-Leaflet data-overlays, their advantage and some other cool stuff.
[…] D3 Mapping Basics more […]
[…] to these cities so I just chose any random point within the city using the finale result of the previous d3 mapping basics tutorial to get the corresponding coordinates! Now…get the *.js file, containing the corresponding […]