Okay let’s be honest: I don’t have any idea of what D3 is capable off (we got Ralf for this crazy rocket science) but what Geoawesomeness posted today about “how the Earth looks like” catched my interest as the video, which was shown in the post, presented a cool animation of different map projections.
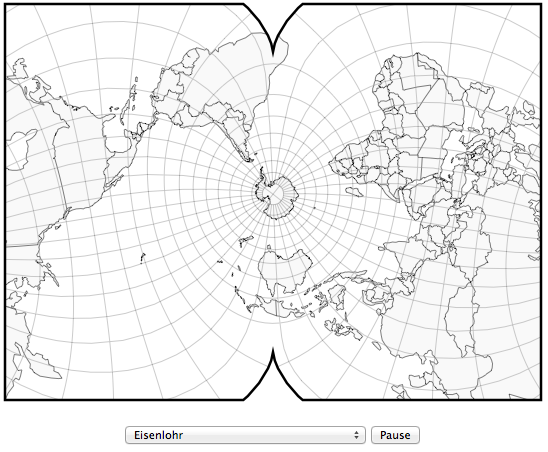
So I watched it and fortunately they posted the links to the used content. So I stumbled upon Mike Bostock’s bl.ocks.org account. Mike is the creator of D3 and you can find there stunning examples on big data visualization which is far more advanced than recent examples I saw by SAP with their CRM on HANA solutions on a recent event. And there was this great example on different projections and a live transition from one to another:
So what is behind this crazy shite? There is this bunch of three D3.js libraries you need to use, a definition of wanted projections which are capable of antimeridian cutting (so the transition works), a function which does the transition according to time and a json with countries and land masses. You can download the working example here. This would be a cool feature for our friends at worldmapgenerator.com.
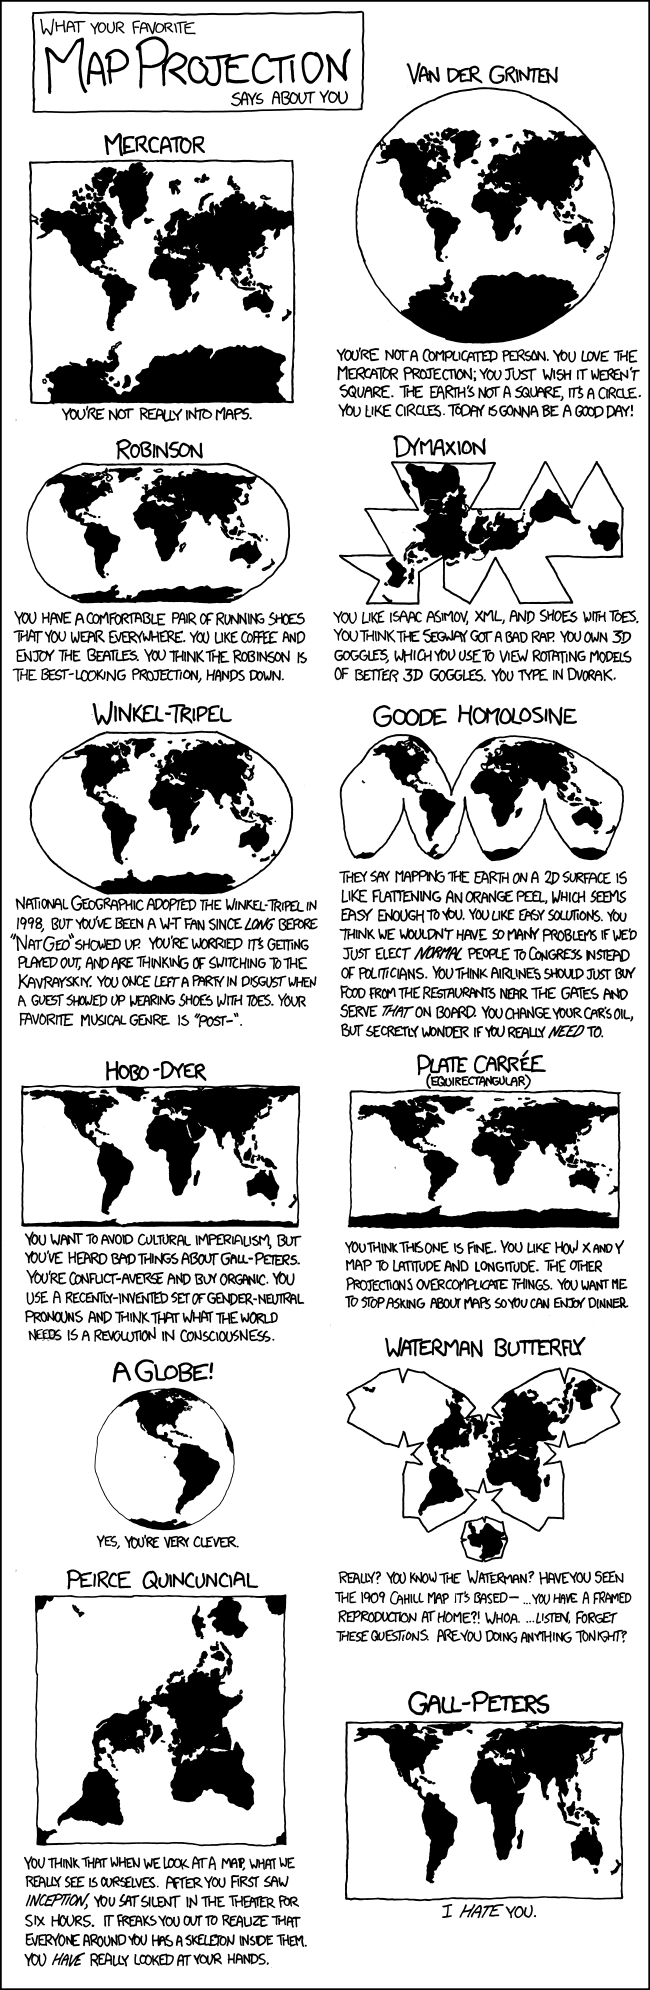
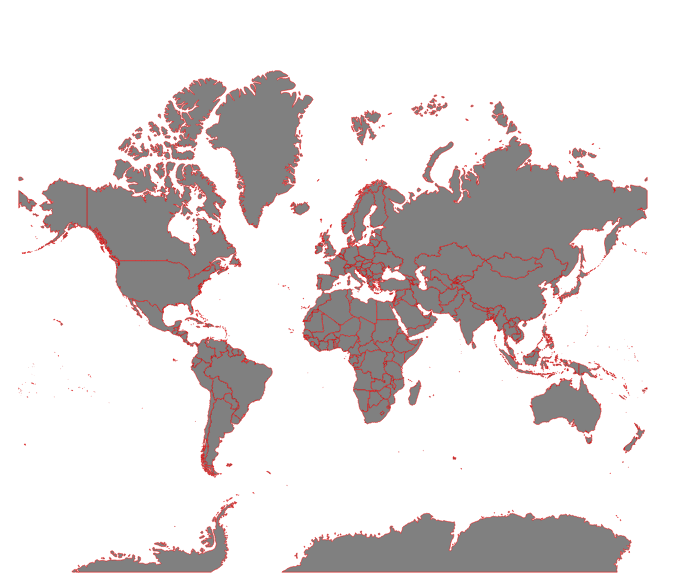
If someone could now show me how to select countries by id and show them in different colors it would be so much more interesting. In the meantime I will look again on this great xkcd analytical comparison of projections:

[…] Okay let's be honest: I don't have any idea of what D3 is capable off (we got Ralf for this crazy shite) but what Geoawesomeness posted today about "how the Earth looks like" catched my interest as… […]
[…] See on https://www.digital-geography.com […]
[…] D3 and the beauty of projection […]