Alright, away from python scripting, I want to share a small tool CSV to HTML 101 with you, guys. I used VB.NET to develop it in order to help non-GIS experts from converting a CSV file to a web page using leaflet.JS library. Honestly, it’s not that complicated tool, but it gives them that push to start a web map especially if they have not dug that deep in web development, javascript and leaflet. However, I’m one of these people, so please don’t judge my ugly code 😳
The developed tool should meet the following criteria:
- Simple enough to be used by my grandma. 😛
- Converting a CSV file directly to an HTML file without using any third-party web/software that could be used to convert them to geoJSON/ JSON,…. (trying not to confuse my grandma 😛 )
- The output is one file only (No CSS or JS source files). That will make it much easier for sharing on any operating system using a web browser.
- The tool should allow the user to choose the desired fields to be displayed in the markers popups.
- The tool should be executable (windows, here) as it does not require additional software packages to run the script.
- The tool should allow the user to insert an abstract about the project
Steps:
- Download the tool from here
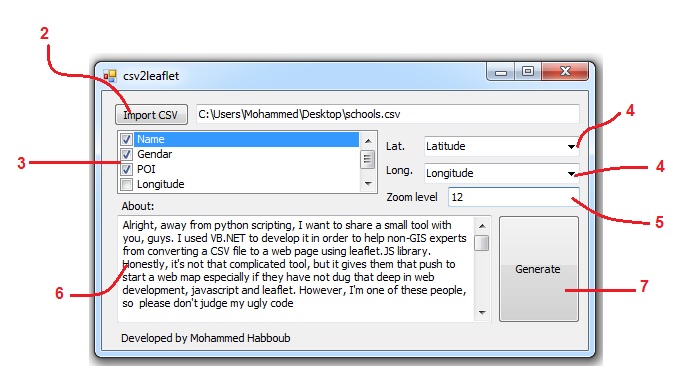
- Click on import CSV and navigate to the desired CSV file: The tool reads the CSV file and extracts the header.
- The fields headers will be loaded in the checkbox: The checked fields will be displayed in the popups.
- Specify the latitude and longitude fields (from the combo boxes)
- Specify the zoom level of the first map: For map initial sets, the center will be automatically calculated based on the markers locations but the zoom level depends on the geographic distribution of the data. (Therefore it’s required here!)
- Write a brief description of the project/ data you are displaying.
- Click on “Generate” button and choose the desired location of HTML file
- Insert the web page title
- Insert the project title
- Done 🙂 (examine it here)
P.S. The tool uses OSM
Your comments are more than welcome
Wow – that´s simple ! I will forward to all my non-GIS colleagues in hope that they will be able to make their own quick and dirty maps and not bother me all the time. THX for sharing and programming! That´s why the internet is so great – it´s a sharing community!
Exactly, Jens ..This is purpose of this tool 😉
Do you plan to exand the tool in the future? If so, I had already one point for the wishlist 🙂
Maybe there could be a field in the CSV that holds colors, e.g. “red”, “green”. Then the user could choose in the tool the color column and voila the groups could be colored. That would allow users to visualize classifications of points very easily but is already difficult for the non-GIS folks if they have to do it in other tools.
cheers
Yup, why not 😉 Thanks for the ideas
Cool! I needed to correct the center, but it works so easy that offends. Great!
Nice to hear!
well, since it’s a general too, it averages both latitudes and longitudes and assigns them to be the center 🙂
It’s a good solution. I don’t know why it did not work correctly with my csv.
Interesting, does it allow some kind of collaborative mapping??
Actually, it is a very basic tool that barely can map you csv files up.
Sorry 🙁
Love the simple interface, however during the generate portion I’m getting the following error message ” Unhandled exception has occured in your application. If you click Continue, the application will ignore this error and attempt to continue. If you click Quit, the application will close immedietly. Conversion from string “Ontario”” to type “Double” is not valid. ” Why is this attempting to convert a string to number? In the CSV file the column is listed as general and each cell begins with a text character so I’m lost as to why it’s trying to convert to a double. Thanks in… Read more »
Hi Tmo,
Most probably, the error is handling the lat. and long. columns. These columns should contain numbers (WGS84 geographic coordinates – decimal formatted like 34.123456). do they?
Yup, formatted properly.
It’s throwing an exception when it’s attempting to change the hometown field to a double type. The “hometown” field is formatted as text in the csv.
Yup, I knew what the problem is.
The “hometown” field contains commas. Since the CSV file is “Comma Separated Values”, the code got confused and assume that it’s a value in the next field (which is the “x”) since a “,” in the CSV file means a new field. As a result, the number of the values in the header will be less by one than in the fields.
The solution: replace the “,” in the hometown with “-” . You can do that easily using (Ctrl+H) in MS excel.
Please let me know if it works 🙂
Sorry for the late response, it does work! Thanks
🙂 happy to hear
Hi,
please explain, why this simple test-file does not work:
ORT,lng,lat
“LaaanderThaya”,16.3875,48.7188
“Aigen-Schlägl”,13.9678,48.6390
“Altaussee”,13.7633,47.6395
thanks
Kurt
Under a german windows 7 the map-center is wrong, when generated. with my simple sample-data I got the following :
var map = L.map(‘map’).setView([483324,333333333,147062],12);
Hi Mohammed, any chances to get this fixed?
yes, I tried it using the coordinates you sent .. it works
tried it again, same result: center-calculation is messed up (as posted above). musrt be a language-specific-problem
var map = L.map(‘map’).setView([48.3324333333333,14.7062],12);
one more problem. Fill in data (#1 to #5) . delete all from box (#6 in your screen shot). now try to enter your own text (e.g. test) —> crash (see screenshot)
Oops, Sorry for that but since it is not English, I can understand what the error says! would you mind translate it?
nmea2leaflet does not work anymore. A problem prohibited the correct execution of the program. Close the program
Sorry, I have no idea 🙁
I tested it on more than one machine, and it works (I’ll keep working on it till I find sort it out)
does your CSV file look the same?
yes!!!
Hi, it seems to be a great tool. Thanks for sharing it. I tried to import a small CSV I have but the generated page ist just a simple, empty OSM page with some explanations on the left side. Do I need to upload the file to a webserver or can I open it from my Desktop?