There are so many applications out there but they probably share one thing: export your data as a XXX-delimited table. And it’s also very easy to create a comma-separated text file out of it. You also have some lat/lon values in this table? Great! Let’s make a heatmap with leaflet.
The Data
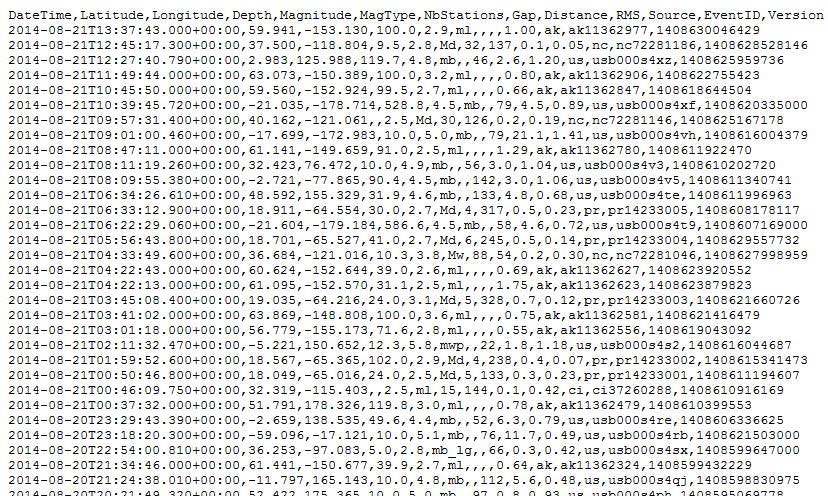
For our heatmap we will need a comma separated table with two columns representing the latitudes and longitudes of our rows/observations/points. So let us take this nice file from the USGS as an example (I know they have GeoJSON 😉 ):
CSV from the USGS with most recent earthquake (M2.5+)
I am not an JS expert but to get this data in my webapp I use the following code in the index.html. I already add all the leaflet js files and initial coding I need as well:
As you see, we call a function at the end of the file loading. Of course we can also do something else in the function when the data was loaded succesfully. Especially for leaflet it is good to have a real JS Object. Instead of
alert(Text);
Let’s create this JS Object by replacing this line with:
data = $.csv.toObjects(Text);
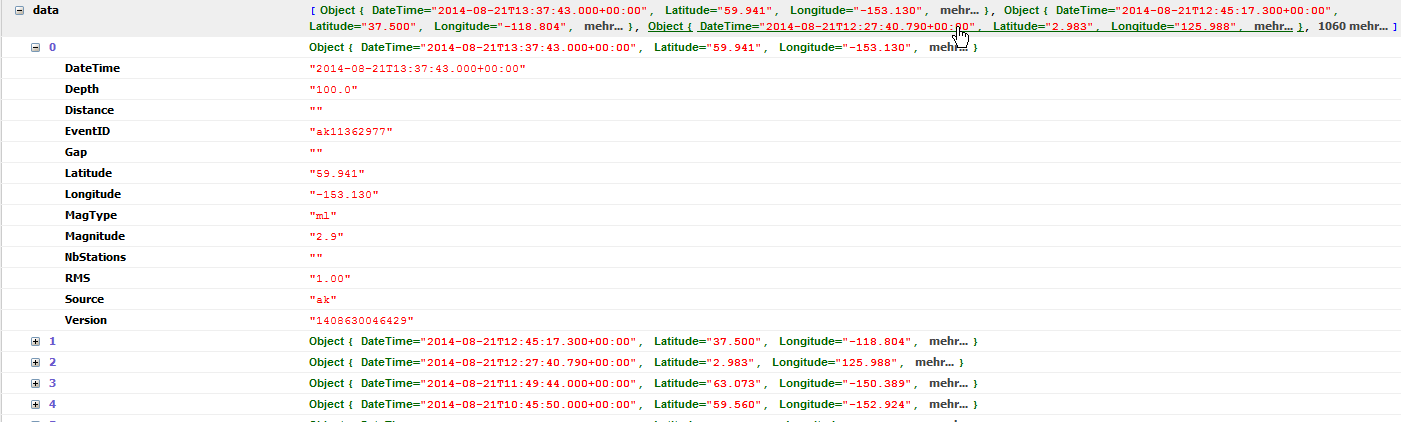
Now look in the code inspector: We have a nice Javascript object in our DOM of the page:
Firebug insight: DOM with the data.
Visualizing the Data as Heatmap
So how to get a heatmap out of the CSV file? As you may have noticed I’ve already added a heatmap plugin for leaflet by placing this line in the body of the page:
This works directly on Javascript arrays so what we will do is to create a new array out of the JS object. As the example CSV marks the latitude and longitude as well as the magnitude as strings we also need to parse them into real values:
  data_array= [0,0,0]; //create it before filling
  for (i = 0; i < data.length; i++) {
    data_array[i] = [parseFloat(data[i].Latitude), parseFloat(data[i].Longitude), parseFloat(data[i].Magnitude)]; // if values are marked as string in the object else:
//  data_array[i] = [data[i].lat,data[i].lon,data[i].val];
};
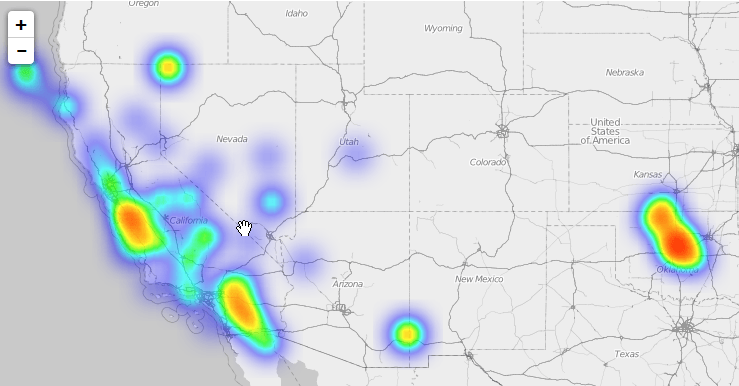
This new array will serve as the input for our heatmap:
As for Oklahoma, I’m no expert, but I’ve heard that the uptick in earthquakes may be a result of fracking in the area.
Christoph Gruetzner
9 years ago
Great post, thanks! The Oklahoma quakes are caused by wastewater injection. All the water used for fracking is pumped back into the boreholes, which results in a change in pressure at depth and quakes. These seismic events are different from tectonic earthquakes on faults (although fault movement may be involved in the process) and also different from fracking quakes. Check this article for some news on this kind of seismicity: http://www.earthmagazine.org/article/human-induced-earthquakes-shake-less
Hi, I have the same issue. the CSV file is no more available on the link. I am trying to use my CSV file from the same folder ( at url: “my_csv_file.csv” ), but it is not recognized.
When Mike Bostock published his (re-) implementation and demonstration of Visvalingams algorithm for line simplification he attracted considerable attention on that. What is a little bit strange in…
What if you want to build your own webmap on your WordPress blog without any knowledge about javaScript, frontend web development and geojsons? You can use a plugin!…
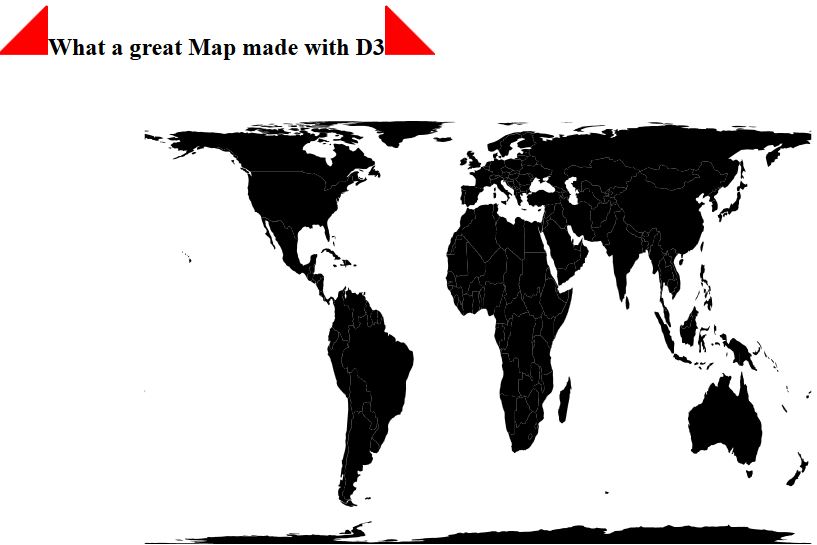
I always watched those stunning examples created with D3 by Mike Bostock, I liked Ralf’s blog posts here and I always thought to myself: get yourself together and…

Nice lesson.
As for Oklahoma, I’m no expert, but I’ve heard that the uptick in earthquakes may be a result of fracking in the area.
Great post, thanks! The Oklahoma quakes are caused by wastewater injection. All the water used for fracking is pumped back into the boreholes, which results in a change in pressure at depth and quakes. These seismic events are different from tectonic earthquakes on faults (although fault movement may be involved in the process) and also different from fracking quakes. Check this article for some news on this kind of seismicity: http://www.earthmagazine.org/article/human-induced-earthquakes-shake-less
Hi Christoph, Hi Ryan,
thanks for clearing things up. I thought about some old salt mines. But wastewater and fracking explains it.
Perhaps only at this moment in time a problem, but the mapnik tiles don’t seem to be loading anymore from openstreetmap. I only get the heat map.
Yeah, I saw this behaviour already on the plugin qgis2leaf. But it looked to me to be a temporal issue
Hi I have some questions about the script, how interpret the csv or what is the format that my csv should have for to be recognized by the plugin?
Hi, I have the same issue. the CSV file is no more available on the link. I am trying to use my CSV file from the same folder ( at url: “my_csv_file.csv” ), but it is not recognized.
If you have found the answer please share.
Hi Folks,
I have changed the link. If it still don’t work, please search here: https://earthquake.usgs.gov/earthquakes/feed/v1.0/csv.php