We have already introduced cartoDB which is a platform for storing, administering and visualizing spatial data. One straight feature of cartoDB is the usage of GeoJSON for exporting their tables. In this tutorial I’ll document a working example on consuming this layer with leaflet. But first we will start with the easy part of creating the table in cartoDB.
preparing the table
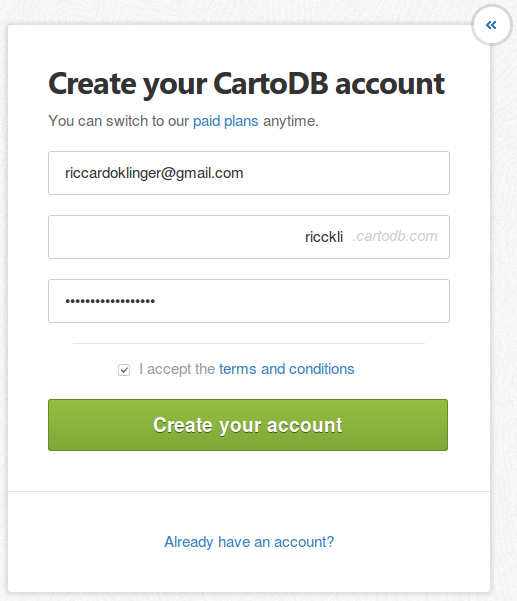
So first of all let us create an account which is straightforward:
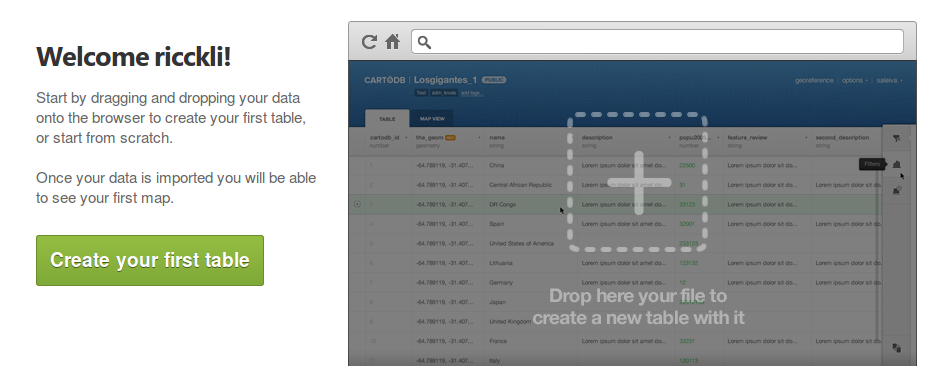
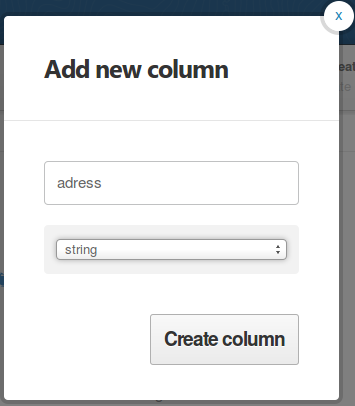
First we will build a table from scratch. As we are dealing with spatial data you need some column for a “location” so you need either to add a field for an address (we will use just one, but this could be stored in several fields/columns as well):
As a first step you will need to add addresses to your cartoDB interface or you can use lat/lon information as well. Nevertheless: we will need to “georeference” this information to be visual on the map:
By double clicking on the cell in the column address you can add you address. In my table which stores informaton about consultancy offices in Germany it is a first one here: “Speicherstraße 1, 60327 Frankfurt am Main”. By clicking on “add row” you can easily create a second object with a new address: “Germany, 50678 Köln, Bayenwerft 14”. In the moment these are just strings without any spatial meaning.
adding spatial meaning
So lets check out the location of these addresses. Please keep an eye on the addresses we have used as the format is totally different. Nevertheless we will be able to use geocoding algorithms embedded in cartoDB to get a coordinate which can be drawn on a map.
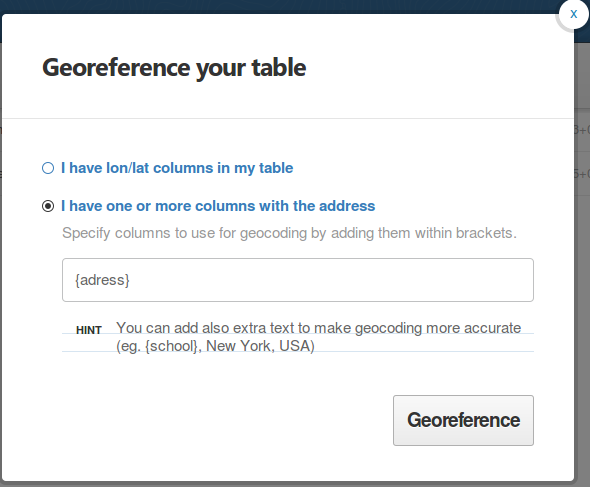
By pressing on “georeference” you are asked whether your location is given by lat/lon or an address. Of course we type the field that stores our address:
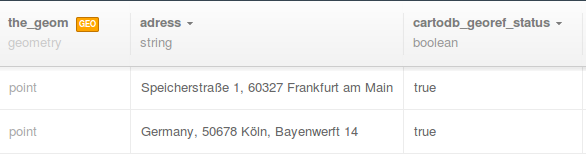
After the georeference function finished you will see things changed in your table: The georeference status changed to “true” and you will get the info that the feature is a point.
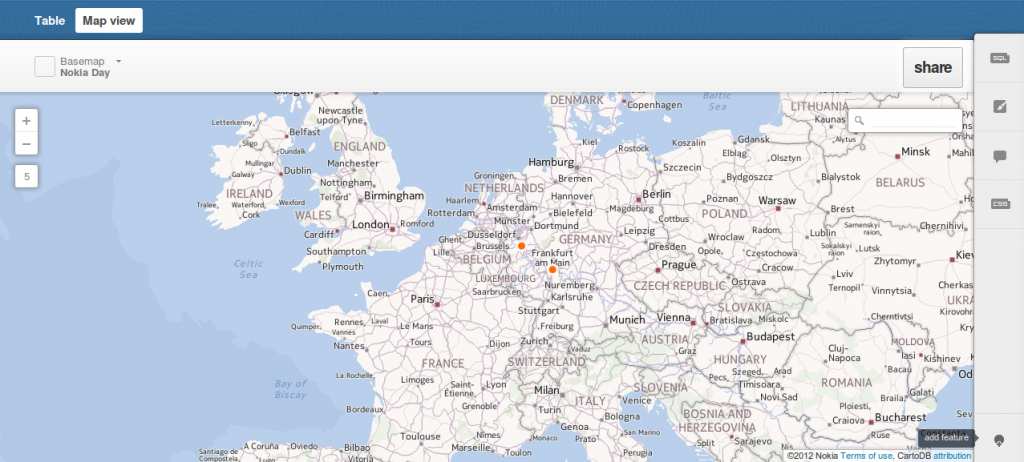
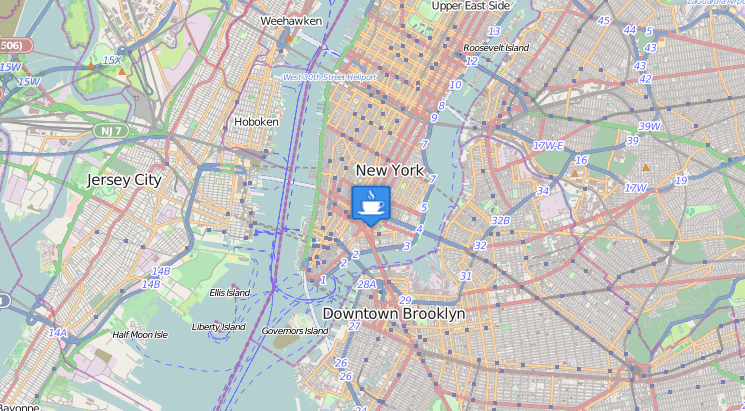
Now you can explore the map and see the both added points on the map:
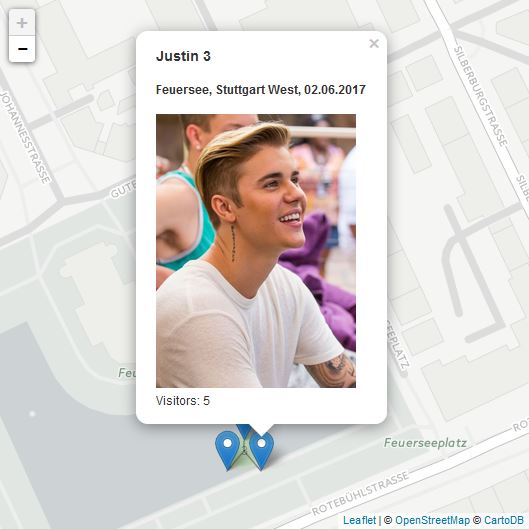
Nevertheless, the pop-up is without any information. The default features for the pop-ups are name and description. So we will add this as we have done with adress in the table view.
By pressing on “map” you will then be able to see the content in the popups and you can choose a different basemap as well. In the end: embed your map which is served as tiles only. This means that no vector data is involved:
In the next session we will concentrate on how to consume the table-data the data using leaflet. Stay tuned!

[…] our first post we concentrated on the creation of a tabkle in leaflet and simple ways to adminster our data and to […]