
I was reading an article entitled “China, the megalopolis of 110 million inhabitants that impresses the world” on a popular online journal (see article) and after a dozen lines read: “Beijing is already surrounded by six ring roads, [… ] but the seventh will be 940 kilometers long.”
How many are 940 km for example along a circle, as the Circular Highway of Milan?
I immediately had the need to go and draw a circle with a circumference of 940 km, because I realized immediately what it was, because the references to the territory, shown in the picture, were not familiar.
See the Pen rOjvvW by PJHooker (@pjhooker) on CodePen.
I pause a moment on the result and I thought: why bloggers do not use the web maps to represent their “articles”?
Perhaps in the last year, with the boom of MapBox, but at the same time also the widespread use (abuse) of Google Maps, the inclusion of the online map in blogs, has increased, but what I’d like to debunk are these two points:
- insert a map in an article, not only for webmasters or mappers;
- to insert a map does not necessarily need a third-party service or some plugins that are often too much for what they serve;
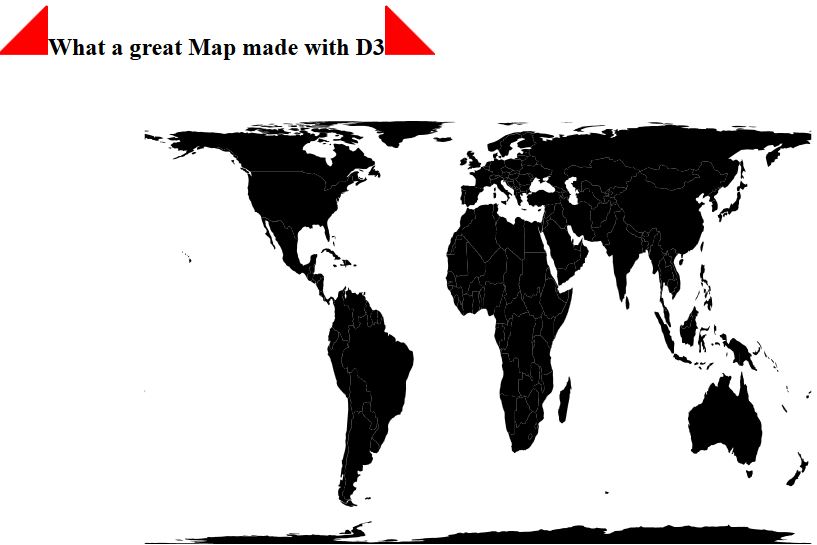
Let me explain how to insert a map in your article, in comparison with the inclusion of an image.
How to create and insert a map web
- go to a site like https://jsfiddle.net or http://codepen.io/
- copy the code from the above map (or go here) and glue the parts in your project
- change the coordinates of the center setview
([45.4613,9.1595], zoom …9.1595], 7);the coordinates of the markersL.marker ([45.4613,9.1595]), written in the popup.bindPopup ("<b> City of Milan, the coordinates of the circleL.circle ([45.4613,9.1595], and the range …149681, { - you can enrich the map by how many points you want, circles, lines and polygons (see tutorial)
- finally sites jsfiddle and codepen have the “share” button will allow you to integrate with an iframe or script, to be pasted in your article, passing in the “html editor” and users of WordPress means moving from the “Visual” to “Text “
- instead of using codepen, if you have access to a web hosting, you can copy the code, create a page
mymap.htmland paste the code to have a map with no other references as in the example below (note the integration stylesheet and script LeafletJS better visible in this map) - passed to the method to insert the HTML in your article (text), and include the map
<iframe src="http: //miosito/nomefilemappa.html" width="300" height="150">
How to create and insert an image of a map
- go on a mapping website like OpenStreetMap or Google Maps or Bing Maps
- capture the screen (note the terms of use)
- open a graphics software such as GIMP or Photoshop, but also PowerPoint
- try to put in place relevant icon and then create a circle, playing on transparency and levels
- of course here you can pick forms and comics
- save the image and export it in jpg
- uploaded to your hosting or other services like Flickr or to store your images and post them
- services like Flickr also generate code to embed HTML code, like “share” button, as if you have just uploaded the picture on some hosting, go to method to insert the HTML in your article (text) and include a map with
<img src="http: //miosito/nomefilemappa.jpg" />
Conclusions
I noticed that an online map is slower (a few tenths of a second) compared to an image, but to make an accurate test, we need to see how they behave, large maps and rich elements. In this case it is definitely not an obstacle.
A web map, loaded on to a service like codepen.io is easily editable, while an exported image, often involves a long time changes.
Enter into the logic of the coordinates, you can create very precise references and represent forms that coincide exactly with the territory, while the images and graphics programs, the signs are vague and it tends to give much weight to the graphic, rather than the reference geographic.
After reading this article, it will be difficult to choose to insert images of maps, instead of web maps; news, articles and blogs, more often telling facts that have a geographical reference and would love to see more and more often applied this trick.
I realized I have not added the feature plus: you can pan and zoom!
References
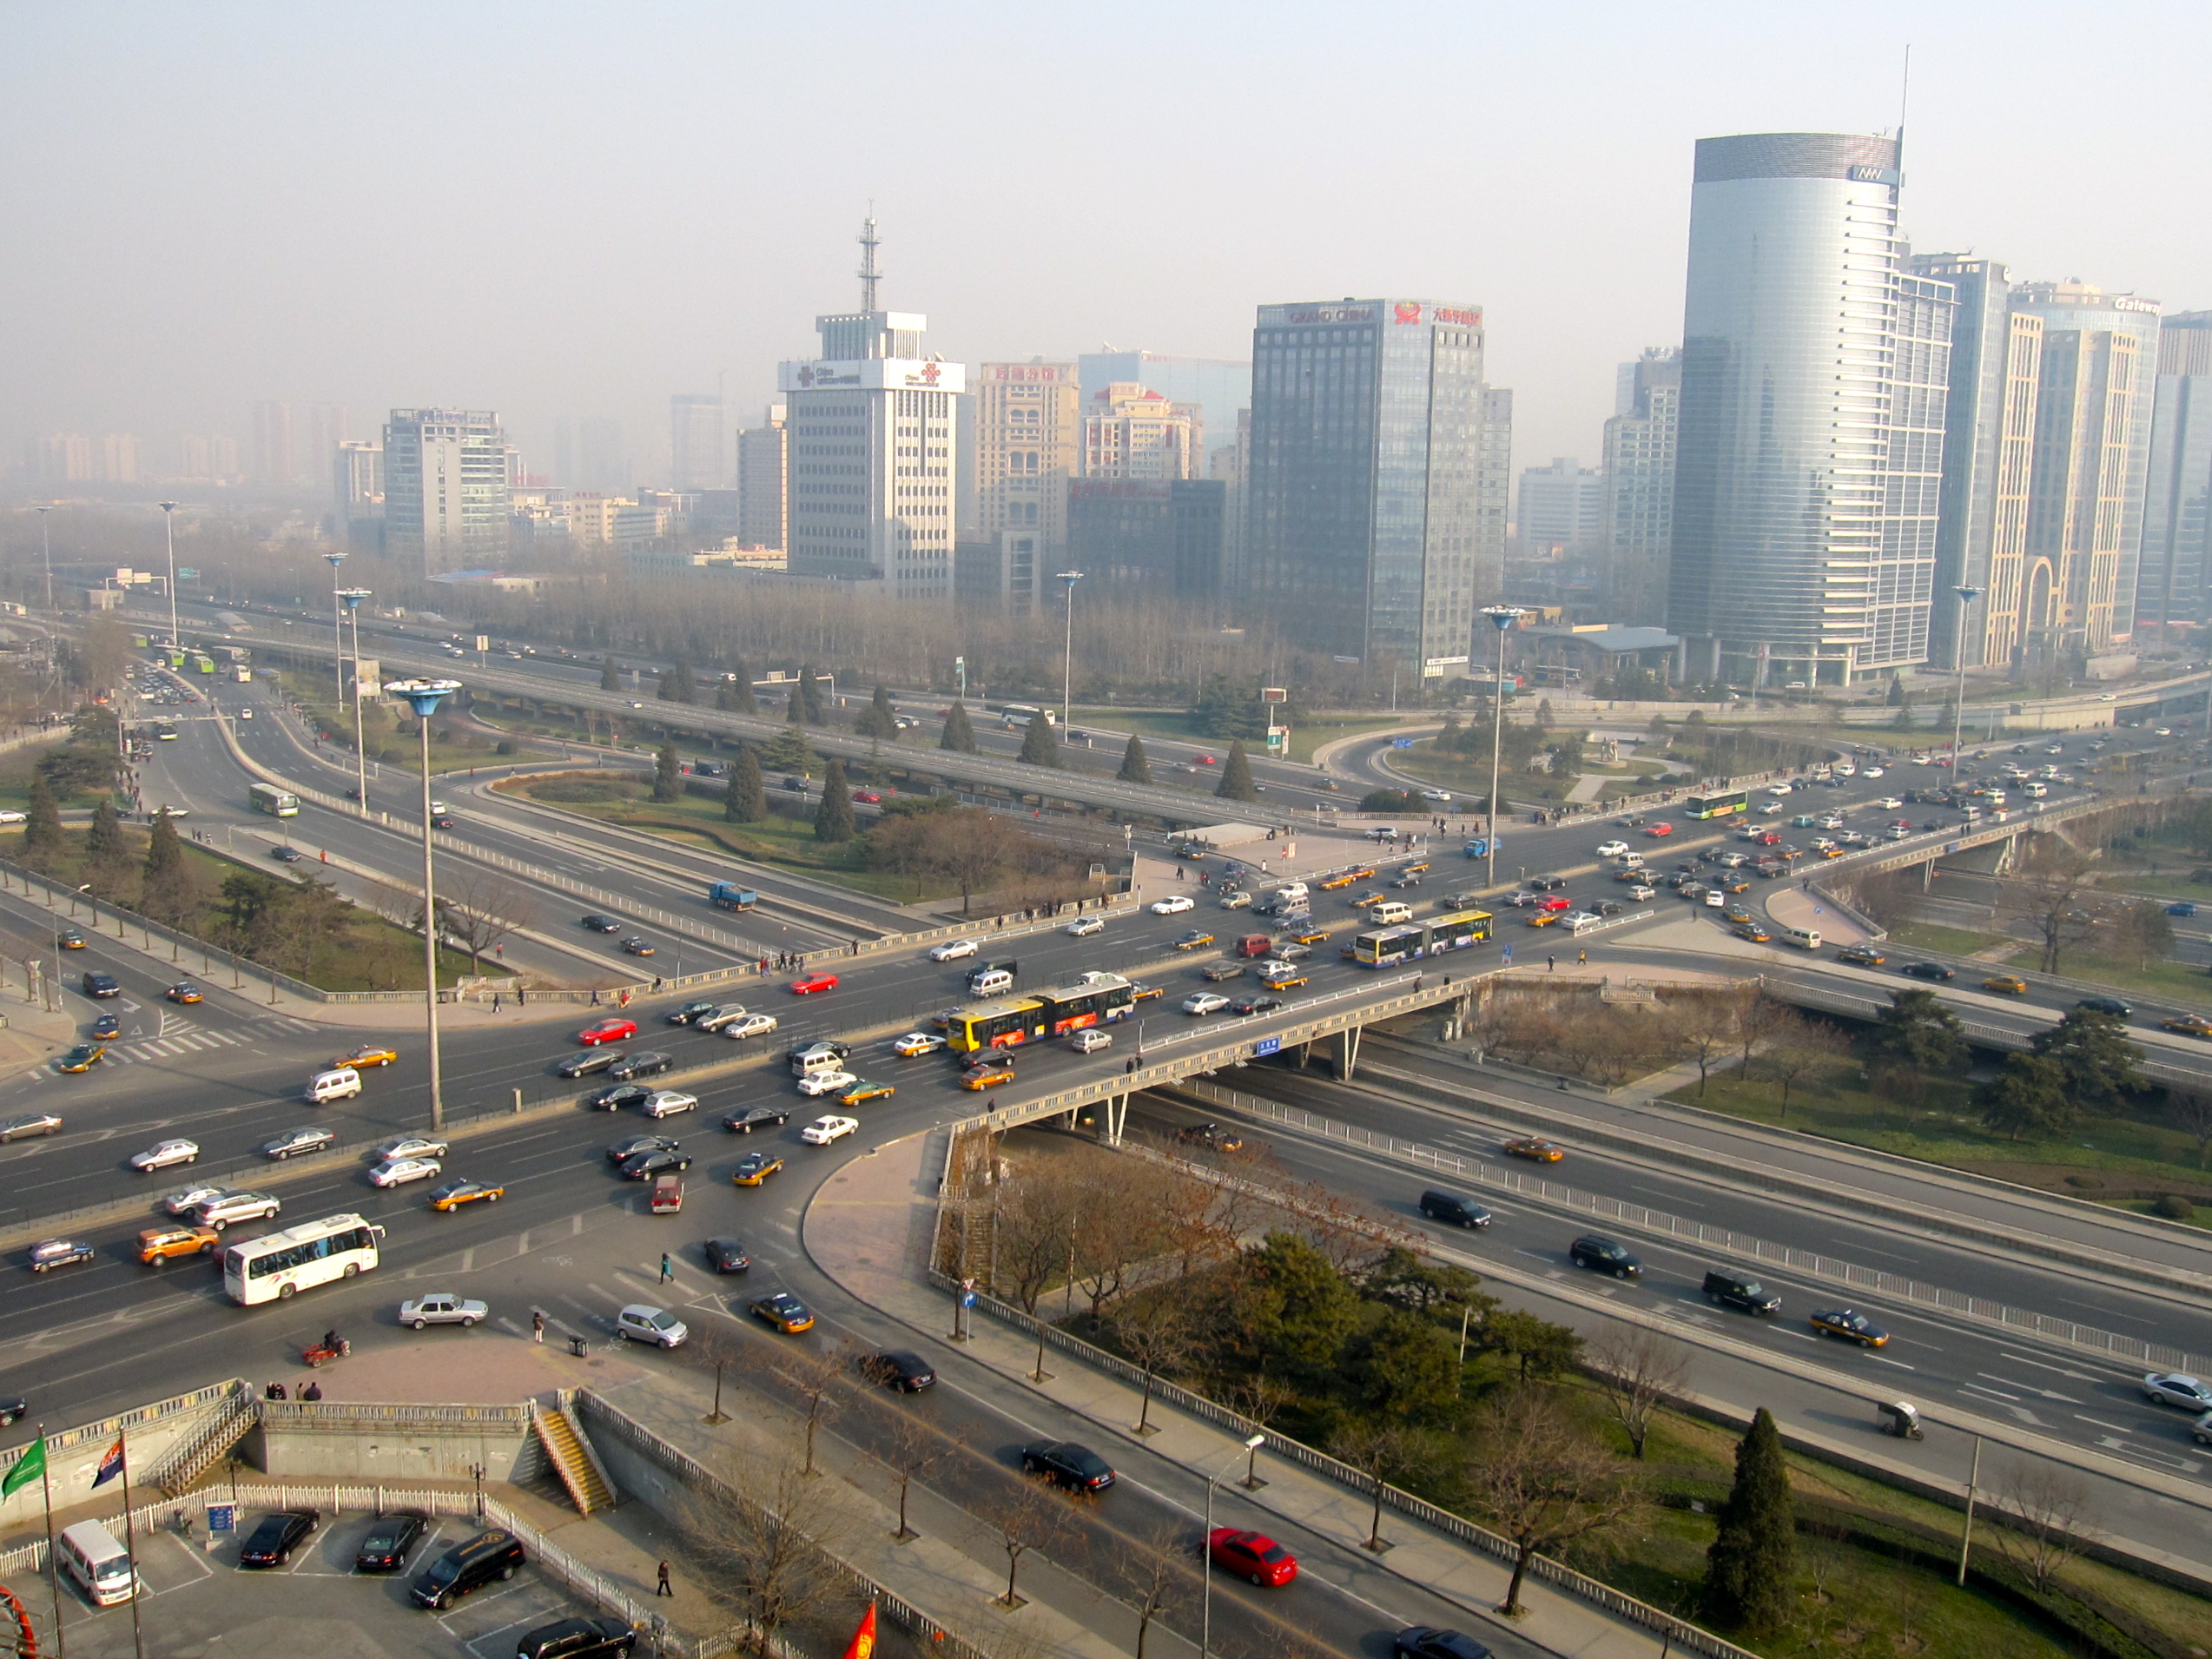
- cover: Interchange between the 3rd Ring Road and Airport Expressway.Autor: Andrey Belenko – Flickr: View of Beijing CC BY 2.0 (url: wikipedia/Beijing_3rd_Ring…jpg)
- map1: http://codepen.io/pjhooker/pen/rOjvvW
- map2: https://github.com/…/map1milano_940km.html
- map3: https://github.com/…/map2pechino_940km.html
- choose a different base map: cityplanner.it/leaflet-providers-preview
- tutorial to enter points, circles, lines, and polygons, icon: http://leafletjs.com/examples.html
- comprehensive manual on library LeafletJS: http://leafletjs.com/reference.html
- calculate the radius from the circumference: http://it.wikihow.com/Calcolare-il-Raggio-di-una-Circonferenza