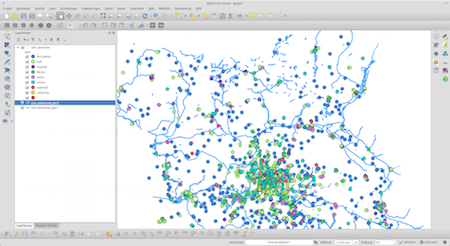
On 24th of February, the QGIS developers have officially released QGIS 3 (codename “Girona”). It is the third major version of the free and open source cross-platform GIS software. In this post, I want to tease you with the most important infos and installation instructions.
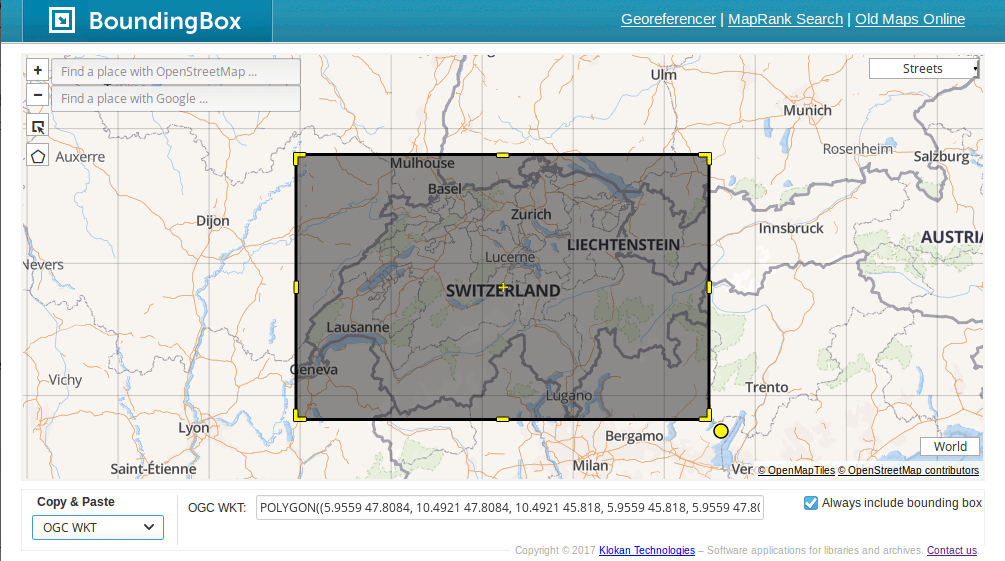
Bounding boxes are crucial for a lot of geospatial projects: wether you need to limit the extent of your web mapping application or need to cut your research data to the area of interest, bounding boxes are used everywhere. Here is a nice little tool from Klokantech that helps you generating bounding boxes in a variety of formats in your browser, without even opening your desktop GIS.
Tiled map layers are an important part of the digital mapping stack, since Google and others introduced their slippy maps quite some time ago. There’s a huge ecosystem of (open source) software for creating and hosting tiles for your custom mapping project. In this tutorial, I want to share what I learned while setting up a tileserver for our projects at Geolicious.
There is this time of the year when the presents are unboxed and the new year hasn’t started yet, when a lot of people (including me) find some time for tinkering on personal projects. And I guess I am not the only one around here who is working on software projects. But because a proper code editor can make a huge difference, I want to introduce you to my favorite tool for the job: Atom, a free, open source, modern and extensible, cross platform editor.
Over the last couple of years, we have seen an increase in demand and offerings of geospatial solutions in the cloud for tasks like web map creation, centralized data storage and management, data vizualization and so on. There is a lot of Software-as-a-service (SaaS) options to explore, but in this article I want to briefly discuss if SaaS is the right thing for you, or wether you should look into rolling your own.
I often find myself in a situation where I want to work with large areas and datasets of OpenStreetMap data. No matter if you want to use them in a QGIS map or create custom map tiles in Tilemill, with the Overpass API you quickly run into performance issues. Imposm is a great tool to overcome that situation, so you can load OSM extracts (worldfiles in pbf format) with a custom data mapping into a PostGIS enabled PostgreSQL database. The downside: It is hard to set up if you are not a database and system admin guru. This is where…
When working with raster datasets, it is hard to keep an overview of the raster files in use and their coverage. Most raster data providers may keep metadata in the filename itself, like path, row and a timestamp. But for more convenience, it is possible to create an index of your raster maps. This article will show you, how to accomplish this in QGIS or with the Terminal.
Dear Readers! At the moment I am working on my master thesis with the focus on stratigraphic data workflows. I have the impression that there is a lot of potential for improvement in the whole process. Therefore I want to rethink the process of stratigraphic data handling from data collection to analysis and visualization. To get an overview of existing approaches, solutions and problems, I want to conduct this small survey. I would be glad if you participate and share. Direct link to the survey
Everyone working with data knows the problem: You found some interesting data for your journalistic project or statistics for preparing a nice map, but the data comes messy and hidden in PDF-files, not automatically readable for your program. Normally you have to write out and clean up the data by hand. But there are tools for that…
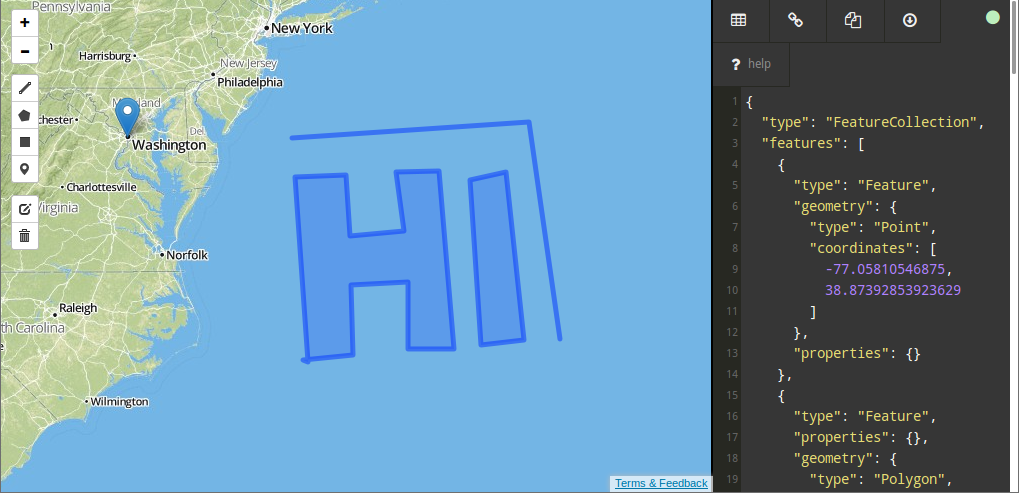
I just found a nice web interface for converting Shapefiles to geoJSON, the preferred format of vector geodata on the web. And yes, you can also convert back from geoJSON to ESRI Shapefile.
The web is built upon a small set of languages that are present everywhere. Besides HTML, Javascript is the most common technology around here. So it is not a surprise that web cartography adapts this technology and uses the native javascript object type to store its vector data. The specification is called GeoJSON (for Javascript Object Notation) and extends the JSON model with geometry fields. But if you ever needed to write some lines of Javascript, you’ll know that it’s brackets can drive you crazy. So why would someone want to write table-like structures in such a quirky format? The…
Today I want to share a Python script that I wrote to plot some lab data against the core depth it was taken from. I know its not very special if you are a Python guru, but I know that many students and scientists have problems to visualize their data in a proper way. My idea was to collect some ideas and developers who are interested to test and to enhance the script. Also, I want it to be open source, so feel free to fork it on GitHub or give feedback. The usage is not that easy at the moment,…
Some days ago NASA has released “Black Marble”, an image of the world by night, a combination of photos taken by a new satellite. Its name was chosen according to the “Blue Marble” image, released several years ago. I like this very much and I decided to make a nice map from it in Tilemill and publish it here. If you want to know how I did it, read on.
OpenStreetMap ist ein wunderbares Projekt, dass ähnlich dem Wikipedia-Prinzip arbeitet und eine freie Weltkarte erstellen will. Damit ist das Projekt auch schon ganz gut fortgeschritten. Wer sich über den derzeitigen Stand informieren will, wird hier fündig. Inzwischen hat sich OpenStreetMap auch zu einer unersetzlichen Quelle entwickelt, wenn man günstig Kartographie erstellen möchte, sowohl für Print als auch fürs Web.