ArcGIS is a geographic-information-system (GIS) developed by ESRI. Being widely used and the sheer amount of functions and add-ons are maybe the important causes for being a big-player at universities as well.
Therefore we will present you some basic tutorials for learning and enjoying ArcGIS:
Tutorial 1: ArcGIS tutorial 1: how to georeference a map?!
Tutorial 2: the ModelBuilder
objective
Create a model with the ModelBuilder to automate different workflows in ArcGIS. Therefore we will connect input-data with different tools in a model diagram.
what do you need
ArcGIS 9 or 10
time effort
depends on model complexity. minimal 10mins
step 1: what is the ModelBuilder?
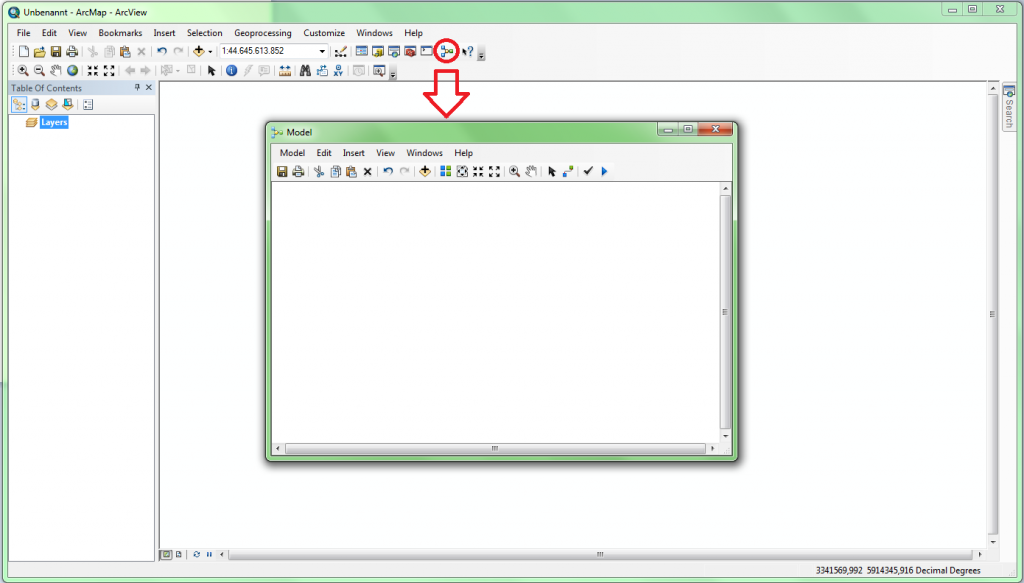
The ModelBuilder is a tool that enables you to create automated workflows to increase your productivity by combining variable input data with applications / tools and output data (link). You will easily find the ModelBuilder next to the ArcGIS Toolbox by looking on the function Modelbuilder window and click to open(fig.1).
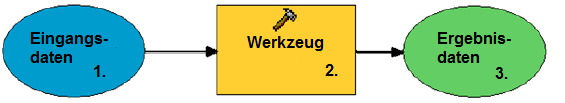
The whole modelling process takes place in this window (fig. 1). There are three different important elements you need to use for building a model (fig. 2):
step 2: Creation of a model
In the second step we will create a model by using the function merge. As we are merging files/data we need to use at least two input data sets (two shapefiles in our place) which should be merged.
1. loading the input data
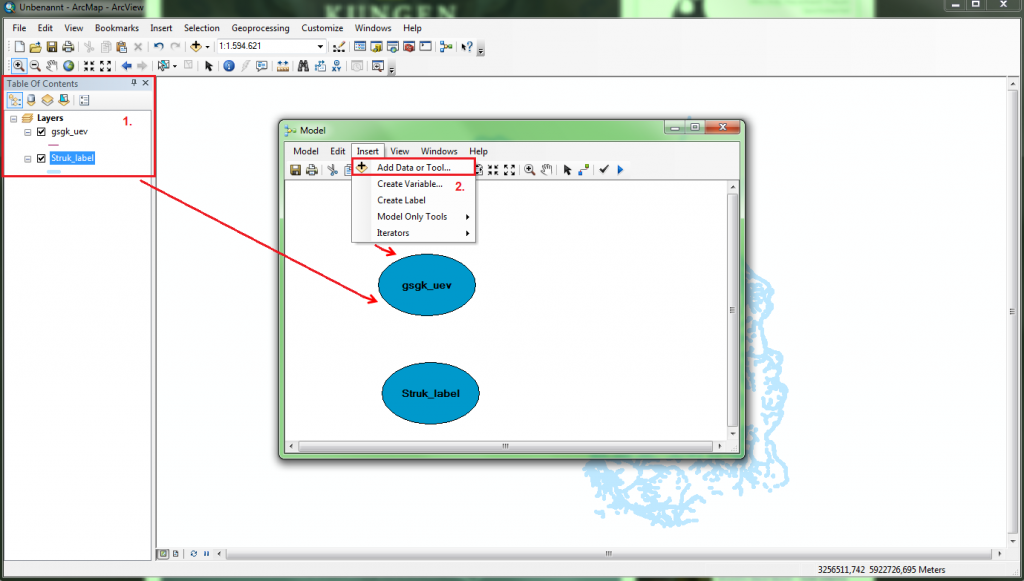
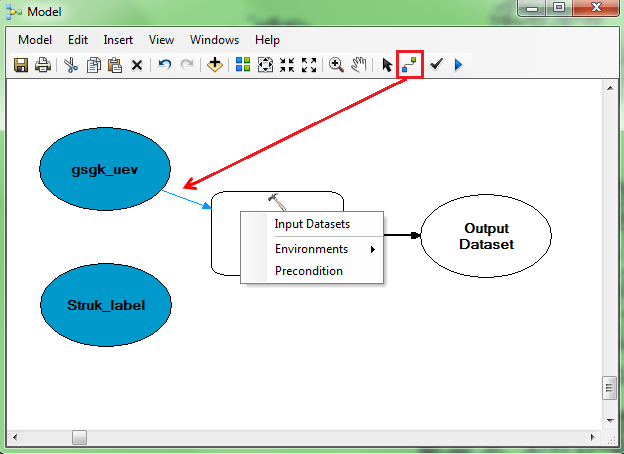
Data can be loaded to the ModelBuilder in two different ways (fig. 3):
2. loading the tools and define resulting datasets
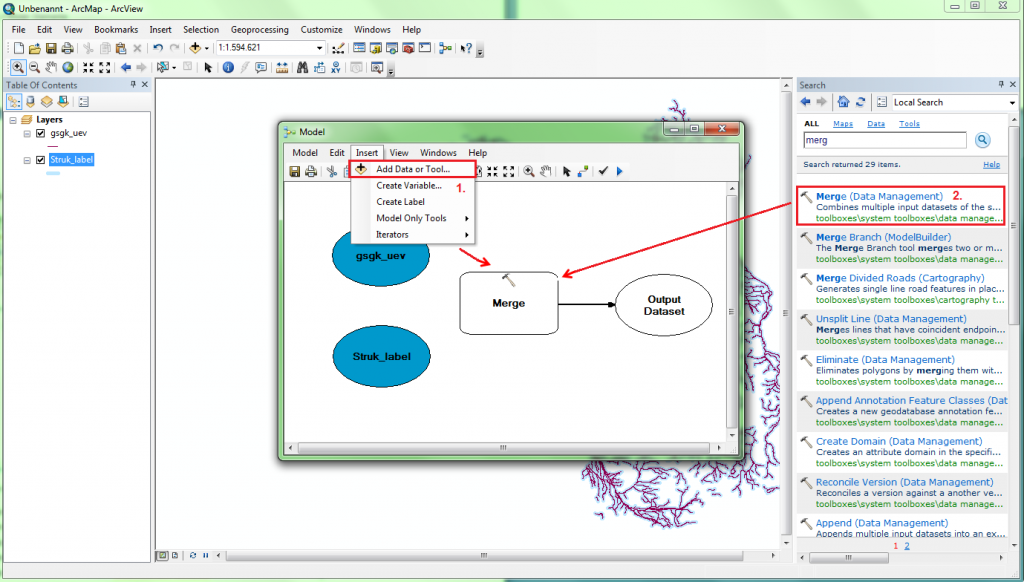
The tools can be choosen on two different ways as well (fig. 4):
In both ways the output dataset is connected with the tool!
3. connect the output data with the model
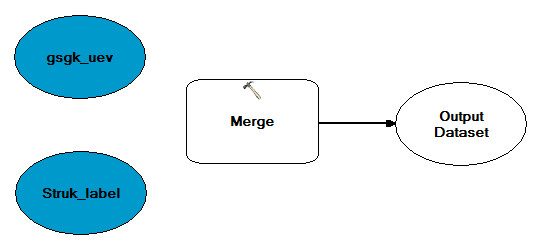
By editing the model you will see some color changes which indicate the status of the model. Fig. 5 shows you a model which needs some adjustements: the tool and the result-data are colored in white.
Using the function Connect you can connect the result data box with the tool and be used as input data as well
(Abb.6).
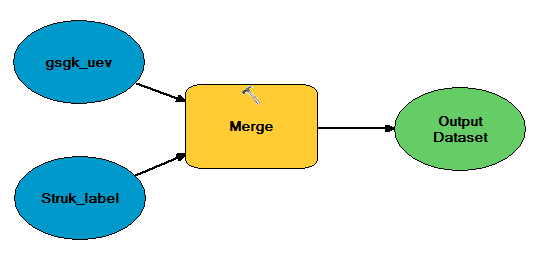
The color changes after the connection. The model is now ready to runauf (Abb.7).
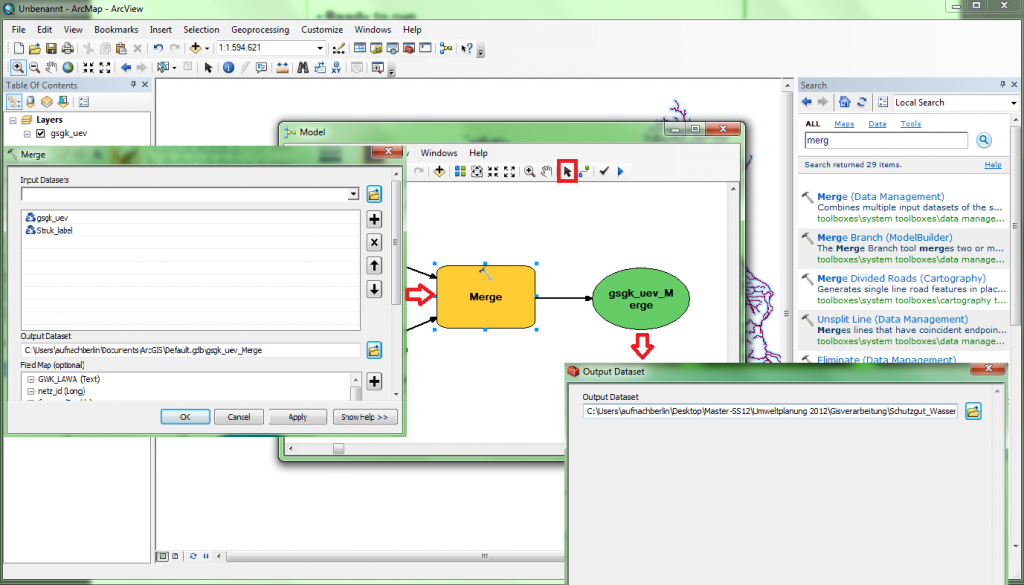
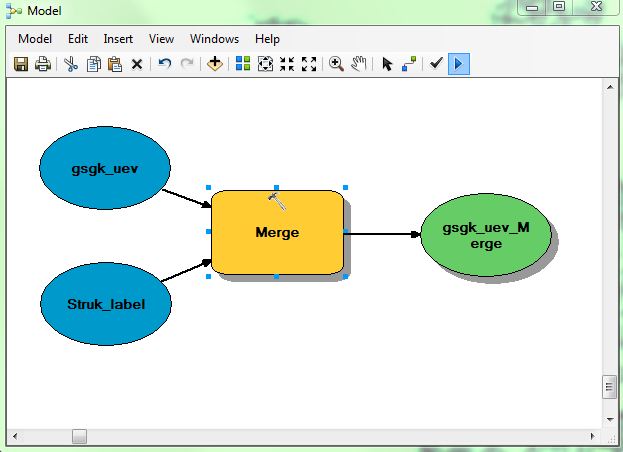
With the function Select you can check each element of your model. If you choose the tool merge (fig.8) you can see, that both datasets were choosen automatically. You may also want to check the result dataset to choose your output folder. Otherwise you need to searchg for your results afterwards…
4. model run and results
Using Run you can start the model. During the model run each active process will be marked red (fig.9) as long as they are active. Each tool can be used for a test-run. This is very helpful if you plan to create very complex models.
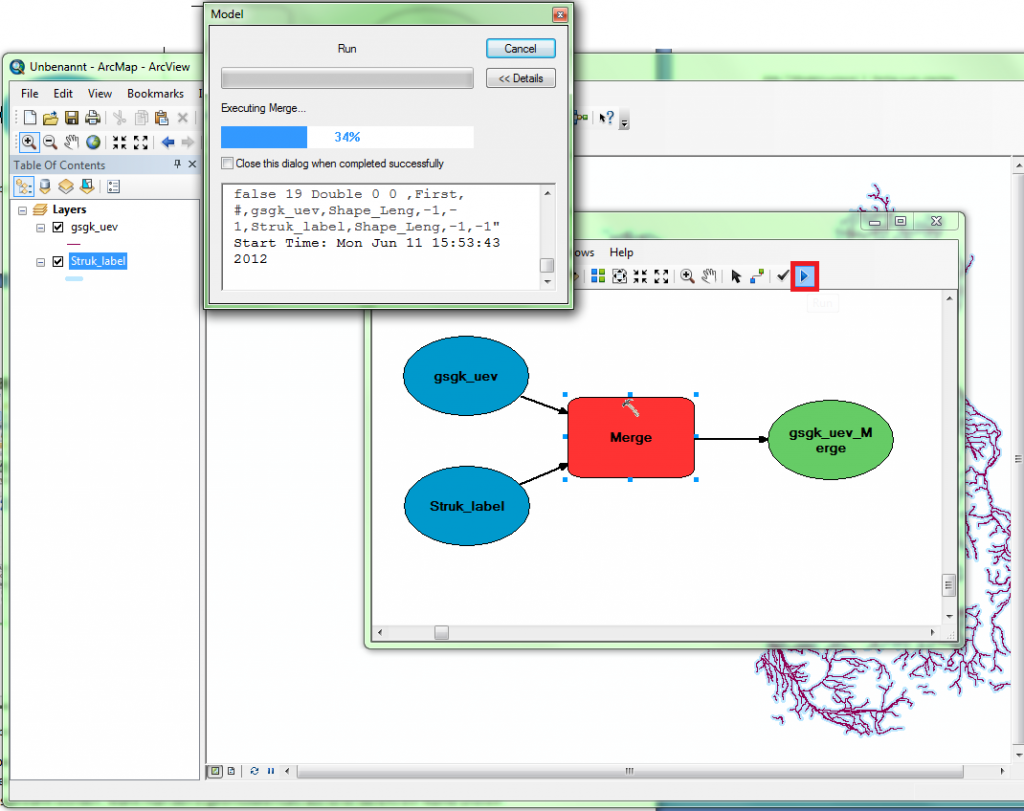
If the run is completed, each tool and result element will be shown in grey (fig.10). The model can be saved using Model >> save so you can used afterwards.